
If you’ve been battling with a slow WooCommerce website and are quickly getting frustrated that your eCommerce store is not fast enough, then this is the guide for you – we’re going to show you everything you need to know to speed up WooCommerce.
How to speed up WooCommerce – for real
This guide is a little bit different from your regular “10 tips to make WooCommerce faster” style guides (and you’ll find no shortage of those knocking around Google). Most existing WooCommerce performance articles are fairly generic and light in terms of detail and while they offer generally good advice they don’t really explain things in detail.
Rather than regurgitate the same advice again, I’m going to walk you through the process of transforming a real life WooCommerce store from a slow underperforming mess into a lightning fast rocket!
Or – if you’d prefer a shortcut, CommerceGurus Turbo automates most of what this guide covers.
Why is eCommerce website speed so important?
It’s costing you money – plain and simple. Let’s condense this down to a few simple facts.
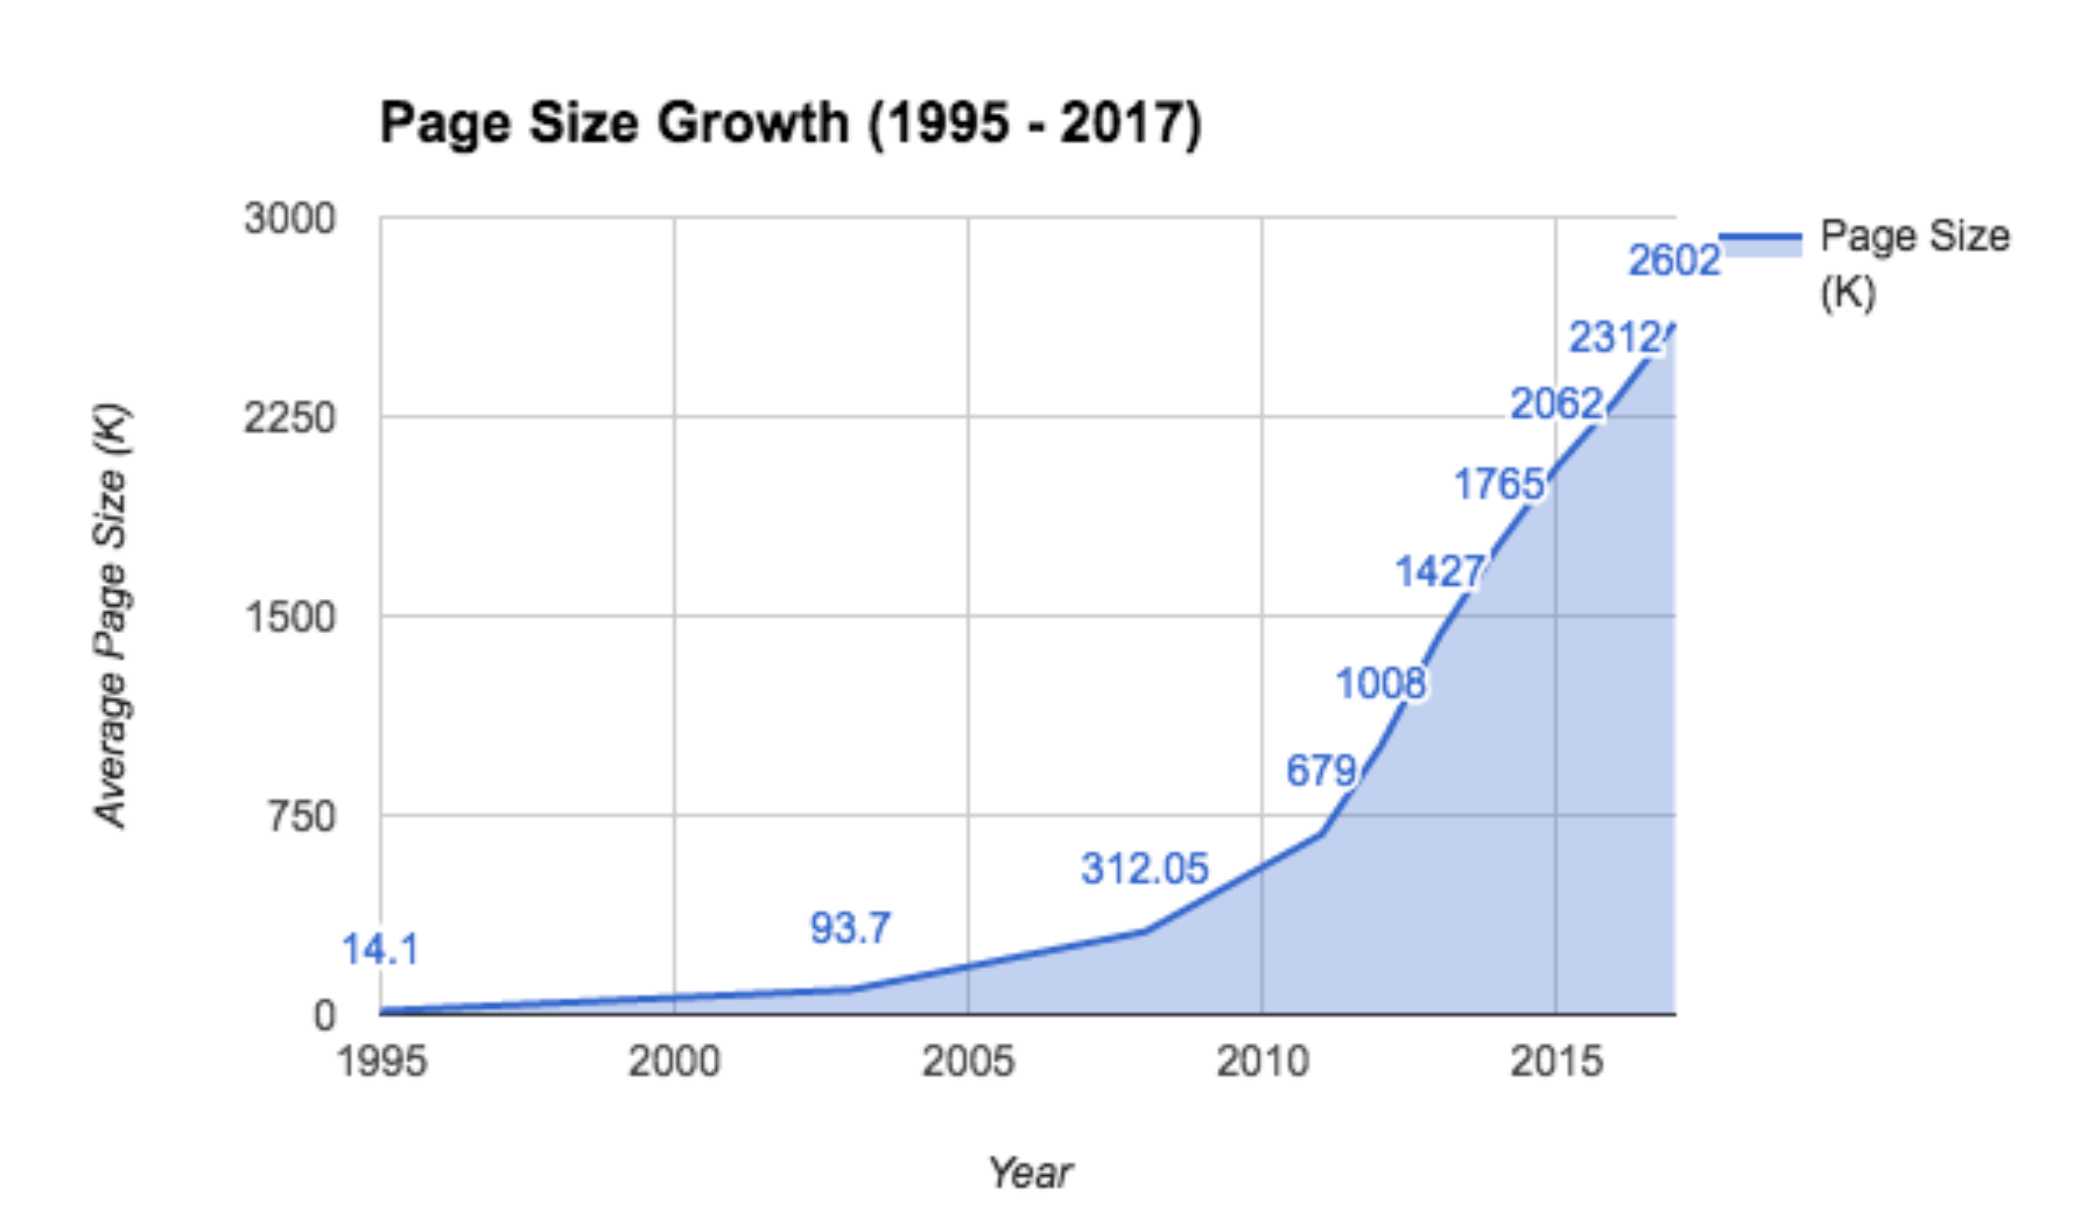
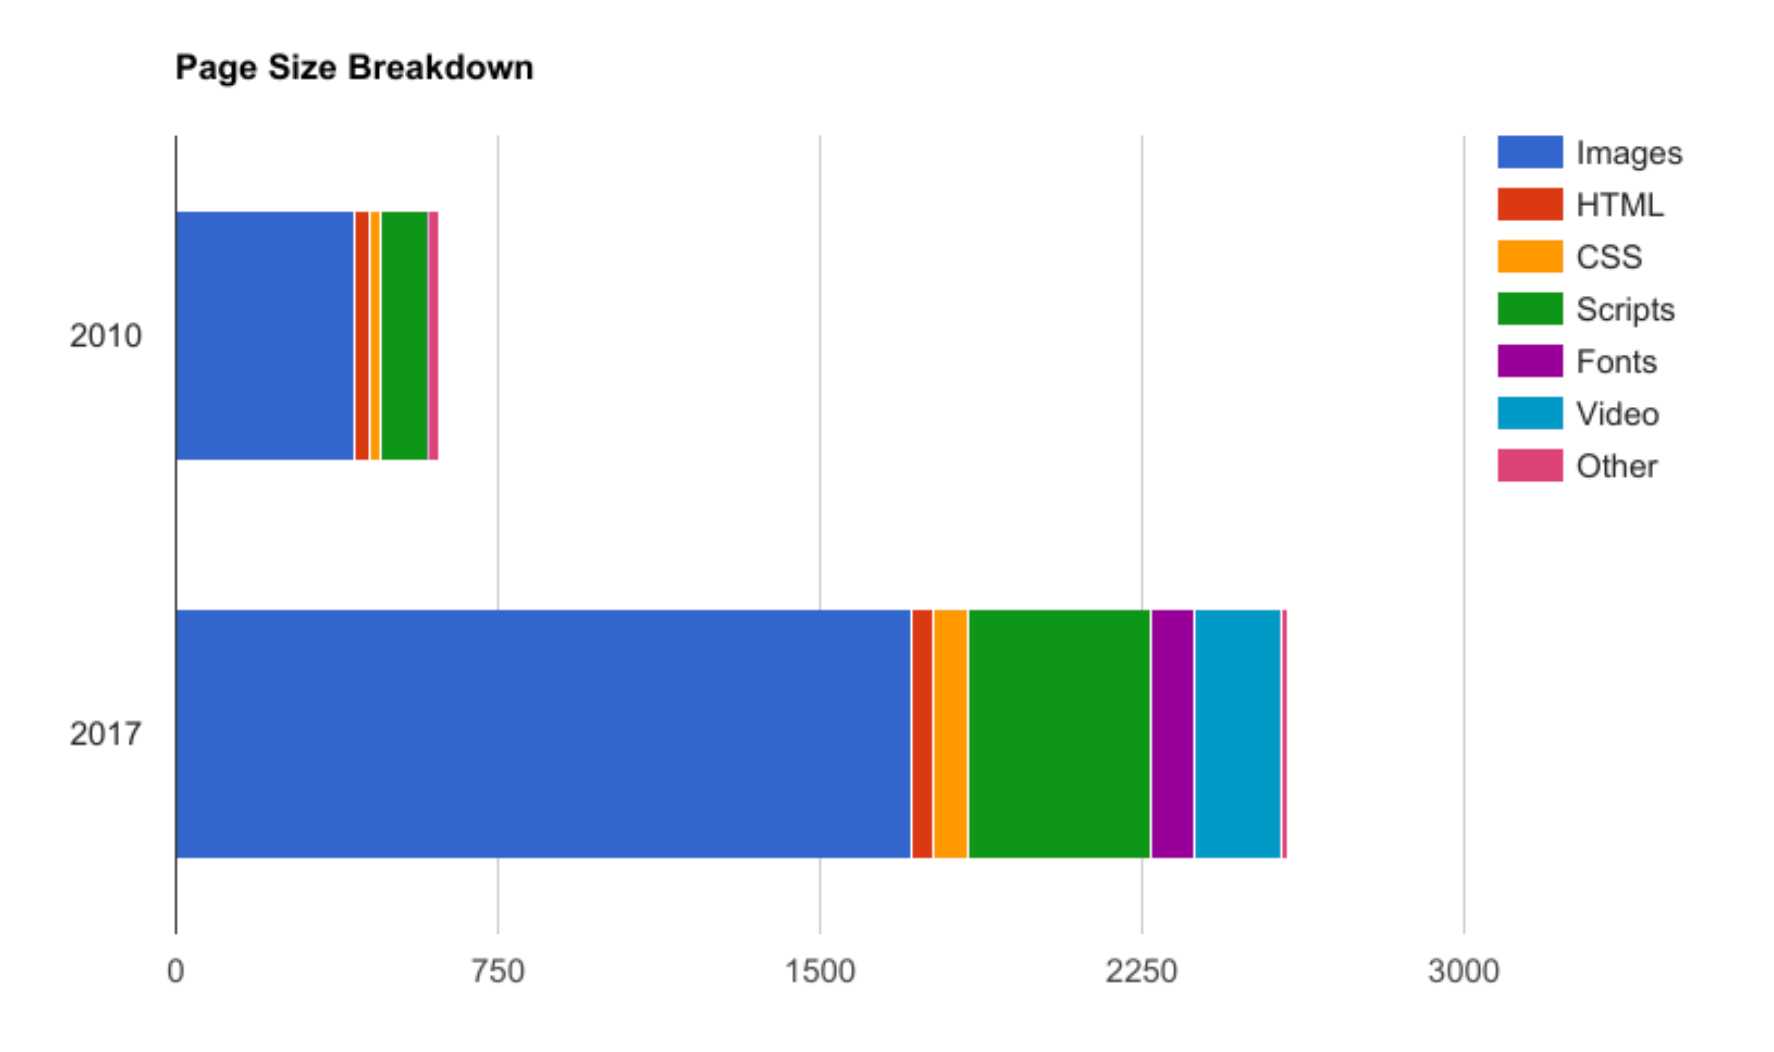
Fact 1 – the web is becoming obese. Average web page sizes have grown significantly over the past 5 years. Images are the main culprit behind this increase. Followed closely by video, javascript and web fonts. The average size of the Top 100 eCommerce websites in 2018 was over 3MB.
Fact 2 – despite what you might think – Internet connection speeds globally remain unreliable and slow. This is particularly true on mobile devices – which are now the most popular web browsing devices.
Fact 3 – Users attention spans are getting shorter. In 1999 the optimal load time of a web page was 8 seconds. In 2017 it was 1.5 seconds.
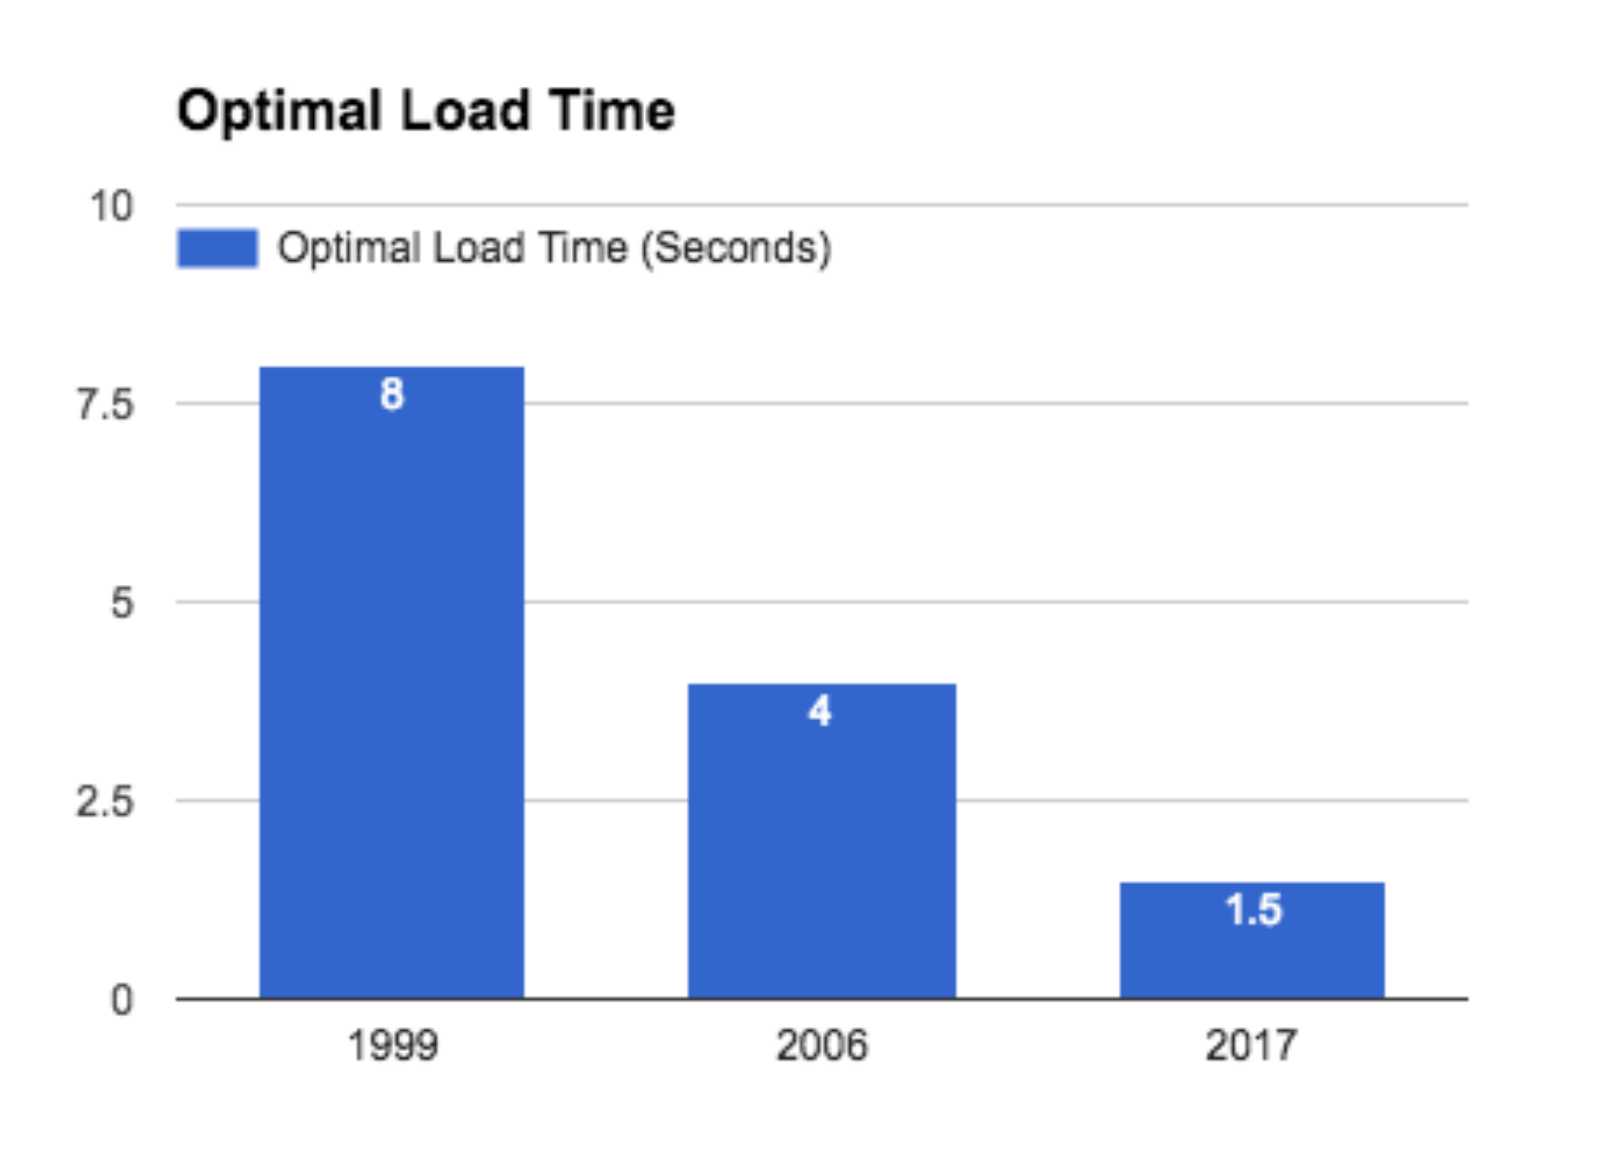 What happened? Information overload happened. If something doesn’t appear in a couple of seconds we know there’s a thousand other little signals competing for our attention and we move on to the next one. In 1999 you needed to wait 20 minutes to download a song that you can play instantly via your Smart assistant. Sometimes it’s easy to forget just how much the web has changed in the past two decades. Our brains are being rewired to expect things instantly. If it’s not instant – it’s dead.
Fact 4 – Website owners have lost the run of themselves and polluted their websites with exit popups, modals, check boxes, chat bubbles, intrusive ads and just about every other annoying trick in the book to try and improve user engagement.
These facts have together created a perfect storm – a perfect storm of crap that is hurting the web – badly. It’s something I’ve covered in a lot more detail in a talk at the WordPress Dublin meetup a couple of years ago.

Things have only gotten worse since then!
As someone who cares a lot about website speed and performance it pains me to say that it’s becoming harder and harder to enjoy websites. If the general user experience of the web is getting worse, you can quickly see how this would impact an eCommerce website.
If your users can’t get what they want quickly, they’re gone. There are tons of Case Studies which have confirmed this with hard numbers to prove it. You’ll find many of them in the slides from the above presentation.
Hopefully that clears up any doubt as to why the speed of your eCommerce website is important.
Why is WooCommerce so slow?
You’ll often hear that WordPress and WooCommerce are slower than Shopify or BigCommerce. There is an element of truth to this statement. Hosted eCommerce platforms employ large engineering teams to tune their eCommerce platforms for speed and performance so you don’t have to.
You can’t just install WooCommerce and expect the same kind of speed and performance as you’d get running Shopify.
With WooCommerce you have to take the time to do the performance optimization work yourself. Sure you might end up delegating the work to a combination of your hosting provider and a developer – but the work still needs to be done – and done properly.
Most of the time I see performance problems with WooCommerce it’s down to one or more of the following.
Poor quality hosting not optimized for WooCommerce
This is probably the biggest one. We’ll talk a bit more about hosting a little bit later. We’ve got a separate in-depth WooCommerce Hosting Guide if you can’t wait any longer!
Not implementing any WooCommerce speed improvement actions
If you’re wondering why WooCommerce is slow and you’ve not implemented any Caching, Image Optimization or asset minification you should hold off judging the platform. You’re not done setting things up yet! Hopefully this guide fixes that.
Plugin abuse
It’s not simply the number of plugins you’re using. It’s more about the quality of those plugins. If I use 1 plugin that outputs 50 css and js files and 5 blocking Ajax callbacks that’s going to have a much bigger impact on my website speed than 20 plugins that don’t output any frontend assets and do very small backend tasks.
Poor quality WooCommerce theme
We’ve been building WooCommerce themes for over 5 years and have seen some absolute stinkers of themes over that time. If you’re using a multi-purpose WooCommerce theme with 100 demos and an unending number of page templates you’re usually paying a heavy hidden cost in poor performance. Our Shoptimizer theme was born out of a recognition that WooCommerce website owners deserved better than that.
So yes, WooCommerce can be slow, but it doesn’t have to be!
My hope is that this guide gives you the necessary skills and tools to speed up ANY WooCommerce website.
As creators of one of the fastest WooCommerce themes on the planet, it’s fair to say we’re a little bit obsessed with making WooCommerce as fast as possible. Let’s dive in!
The WooCommerce Performance Improvement Process to speed up WooCommerce
Whenever we’re asked why WooCommerce is so slow, we first try to unpack the question a little bit and apply a tried and tested WooCommerce Performance Improvement Process (WCPIP) which helps to do a few things:
- Step 1 – WooCommerce Speed audit – establish baseline speed and performance metrics for your eCommerce store via Performance Tests.
- Step 2 – Waterfall Analysis – conduct waterfall analysis of your baseline metrics to identify your main performance bottlenecks.
- Step 3 – Implement speed improvement actions – based on waterfall analysis.
- Step 4 – Re-run performance tests to measure impact of actions.
- Rinse and repeat.
By taking this methodical approach to each finding in our Performance tests we can isolate exactly what is causing WooCommerce to load slowly and we can also measure how effective each of our actions were to improve performance. We’re going to explore each step in the WCPIP as we go through this guide.
Slow WooCommerce Website Case Study – HeadSoundsDirect.com
If you’ve subscribed to our YouTube channel and watched our eCommerce Website tutorial the case study website should be familiar to you. That’s because it’s one of our own WooCommerce websites 🙂
HeadSoundsDirect is a real WooCommerce store which we use as one of our playgrounds to run conversion and performance experiments before we incorporate them into our WooCommerce products. If you watch the tutorial you’ll see me go through the process of building HeadSoundsDirect from start to finish. (And I do really mean right from the start of brainstorming the domain name!). One big thing I didn’t get time to cover in the tutorial was how to ensure the website loads as fast as possible. For that reason it makes for a perfect case study for this guide.
Many of our own customers often ask us for help with the speed of their WooCommerce website at a similar starting point to where HeadSoundsDirect is right now, so if you’re in a similar starting position then this guide should really be useful to you.
So let’s give into our tried and tested WooCommerce Performance Improvement Process (WCPIP) and find out why this WooCommerce website is so slow.
WCPIP Step 1: WooCommerce Speed Audit
The first step is to actually establish precisely how your eCommerce website is performing with a speed audit. There’s no shortage of speed and performance testing tools out there, but there’s only a small handful that we use on a daily basis and that we endorse. Let’s take a look at each one.
GTMetrix (GTMX)
GTMetrix is a frickin’ amazing product. Once you spend time using and abusing it deeply you’ll wonder how you lived without it. In short, GTMX will give you a detailed analysis of every aspect of the performance of your website in seconds.
For many years WebPageTest (WPT) was the first website I opened when starting a new set of performance tests. While WPT is still an important part of my webperf arsenal, I’ve found myself using GTMetrix more and more for rapid testing. GTMX and WPT both do very similar things, but do them in different ways. The big advantage GTMX has over WPT for casual performance testing is that it’s a hell of a lot faster.
WebPagetest.org (WPT)
While GTMX is awesome for getting some baseline metrics quickly, WebPagetest.org (WPT) excels at going beyond the basics to produce a forensic level of detail about the performance of your website. The trade off is that it typically takes a few minutes (and sometimes longer) for your tests to run. So my workflow usually involves running my test target website through both GTMX and WPT in parallel and starting to analyze the GTMX results while the WPT tests are still running.
WPT goes beyond GTMX in a few important areas for low level performance analysis like Content breakdown analysis and Main-thread Processing breakdown analysis. Once you’ve dealt with the low hanging fruit quick win actions, those 2 reports are invaluable for the more complex performance improvements you might need to implement. But we probably won’t need to spend too much time with those reports today, just know that they are there ready and waiting for you when you really start to master performance analysis 🙂
Google PageSpeed Insights (GPSI)
Last but definitely not least is Google PageSpeed Insights (GPSI). PageSpeed Insights is the tool that people are probably the most familiar with. It’s also the tool that causes the most grief to anyone who spends time analysing website performance. Let’s briefly explore why PageSpeed Insights has traditionally been such a source of anxiety to performance specialists:
Overly simplistic scoring system
Any time you take a complex topic like website performance and try to package it up into a single score you’re playing with fire. But that’s precisely what PageSpeed Insights does. (OK, two scores when you count Mobile and Desktop scores – but you get the point).
Perhaps it’s that simplicity that explains why PageSpeed Insights has become such a popular performance testing tool. But that simplicity comes at a cost. And that cost is confusion. We hear from WooCommerce website owners worried about their GPSI scores on almost a daily basis. They’re confused about what their low GPSI scores mean and what they can do to improve them. So Google has done a great job at getting everyone to pay attention to GPSI, but historically a not-so-great job at getting people to understand what it means.
GPSI doesn’t give us the same level of detailed reporting as GTMX or WPT. You won’t find any kind of detailed waterfall metrics in GPSI reports. What you will find is a far greater emphasis on things that tend to hurt website performance on mobile devices specifically. (and while both GTMX and WPT do allow for mobile device testing, they certainly don’t lead with it as a default).
So you can quite often up in the situation where a website can load in under 2 seconds (which most people agree is a very good thing) but still have a terrible mobile GPSI score. This makes website owners confused and frustrated.
Similarly it’s possible for a website to have a great mobile/desktop GPSI score and actually take a very long time to fully load.(although it’s less common in the wild).
There will be times in this guide where I will make recommendations which don’t really help your load time/overall speed, but which I know will help your GPSI scores. In the past I dismissed such advice as being a waste of time. But given the increased emphasis Google is placing on achieving high GPSI scores, I’m ok with doing this as long as it doesn’t hurt our overall page loading times.
It’s a Google product
Google designed GPSI primarily as a tool to help developers understand things that might be affecting their website speed.
But if Google decides to make a tool that gives your website a score you can bet your bottom dollar that the world and its mother (who are not developers) are going to want to get their hands on that tool.
The vast majority of websites rely on Google search traffic to survive – what Google says about your website really really matters to website owners. Most website owners will worry far more about their GPSI scores than what GTMX or WPT says about their website performance – simply because Google is Google.
So now we have a technical tool designed primarily to help developers tackle complex performance optimization challenges being used by non-technical website owners like an end of term grade report card on what Google thinks about the usefulness of their website as a whole. That’s despite speed being only one of hundreds of signals Google use to determine the visibility of your pages for any given search phrase. But the really big important signals like Content quality and relevancy don’t have an externally visible scoring system like GPSI.
So a big mistake I see many website owners make is that they use their PageSpeed scores as a proxy for ALL Google’s internal algorithm scores.
Do NOT make this mistake!
There are millions of websites that have dog slow websites that rank above much faster competitors, precisely because they kick ass at more important ranking factors like Content quality, relevancy, authority, backlinks and so on.
If your Google PageSpeed score is low, who would blame you for assuming that low score was in some way lowering your visibility in Google search results? When GPSI first became popular, developers (including me!) spent a lot of time explaining to website owners that your GPSI score didn’t actually measure the load time of your website. Our friends at WP Rocket perhaps captured this best in their popular blog post about why you shouldn’t care about GPSI.
But a few things have changed since that post was first written:
- GPSI itself has gotten much better as a tool for measuring page speed! Thanks in no small part of switching to using Lighthouse in 2018.
- While, there was some historical evidence that Google paid close attention only to TTFB (and not much else) as a speed/performance ranking signal, the reality in 2019 is that Google now IS using much more nuanced GPSI signals in mobile search ranking.
With mobile first indexing quickly becoming the default search experience for most of us, it turns out that we really should care about Google PageSpeed insights and what it tells us about our website performance.
At the same time, it’s crucial to remember that even if you manage to score get ace your PageSpeed scores, those alone do not mean you’ll all of a sudden start outranking your competitors who have done a better job than you at other ranking factors.
The really interesting question for which we don’t yet have any good data yet is just how important mobile-first speed metrics are on search results performance. As mobile first indexing becomes the default Google search experience for most of us I’m sure we’ll start to see some in-depth research on this, but as of yet we don’t really have good data on this.
Summary on Speed Audit tools
For all of the reasons described above, I end up using all three tools to conduct a speed audit. GTMetrix quickly gives me the lie of the land, WebPagetest.org gives me the extras when I need them and Google PageSpeed Insights tell me where I am as far as what Google considers important. Let’s jump into the HeadSoundsDirect speed audit!
Speed Audit for HeadSoundsDirect
I generally run 3 rounds of tests with each testing tool to ensure I’m seeing consistent results. It’s almost certain that you’ll have some variability in your test results. Generally if you’re seeing a difference of between 300-500ms in load times between test runs I don’t get too concerned. There are many reasons for this including:
- Internet network congestion and natural latency of the internet means you’ll always get some variability in speed of packets with each unique request.
- Congestion on the machine you’re running the test from.
- Congestion on your hosting platform (although this will be an important topic for a future guide on load and stress testing!).
So while I’m showing screenshots of individual test runs below they’re representative of the scores and grades observed in multiple test runs with each tool.
GTMetrix Report
We’ve used the default GTMX location and device options (at the time of writing) which are:
- Testing Location: Vancouver, Canada
- Device details: Chrome (Desktop) 62.0.3202.94, PageSpeed 1.15-gt1.2, YSlow 3.1.8
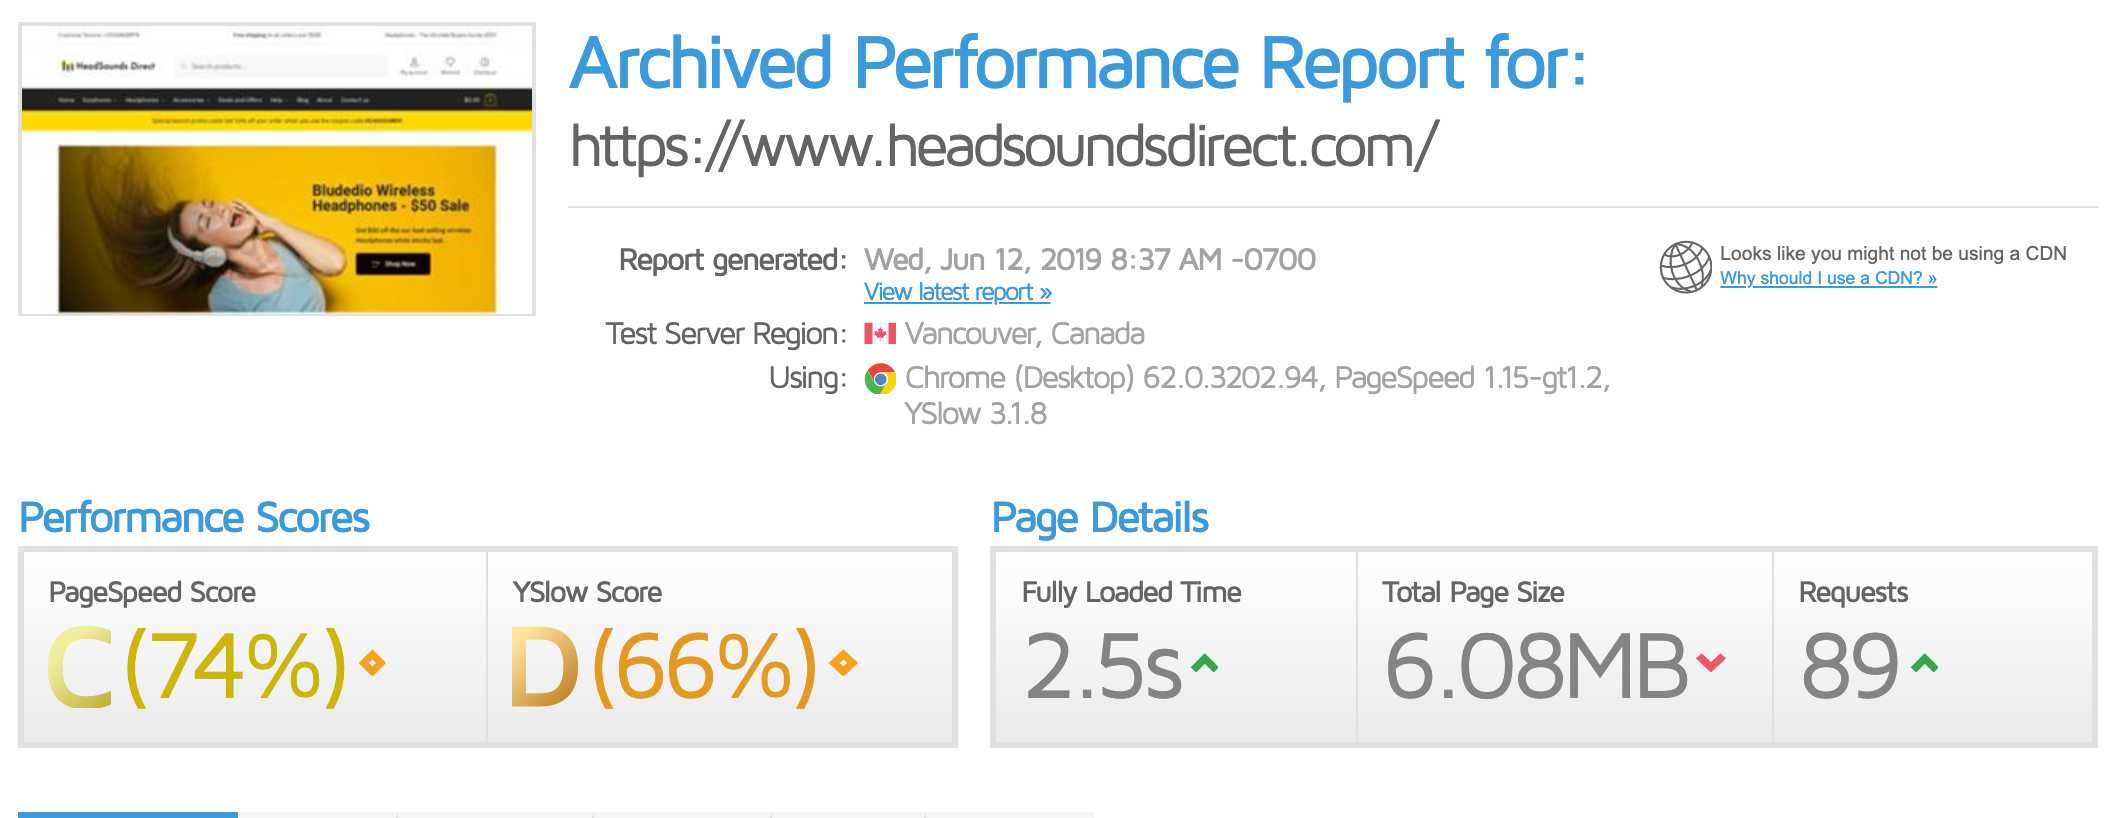
GTMX Findings
Some quick findings from our first pass with GMTX (even before we do any kind of waterfall analysis).
- Fully loaded time (FLT) of 2.5 seconds is pretty good without having done any kind of performance optimization.
- Total page size (SIZE) of 6.08MB is the standout red flag from this initial test – that’s way too big!
- Total number of requests (REQS) is 89 – that’s also way too high.
WebPagetest.org Report
- Testing Location: Chicago, Illinois, USA
- Device details: Chrome – Cable
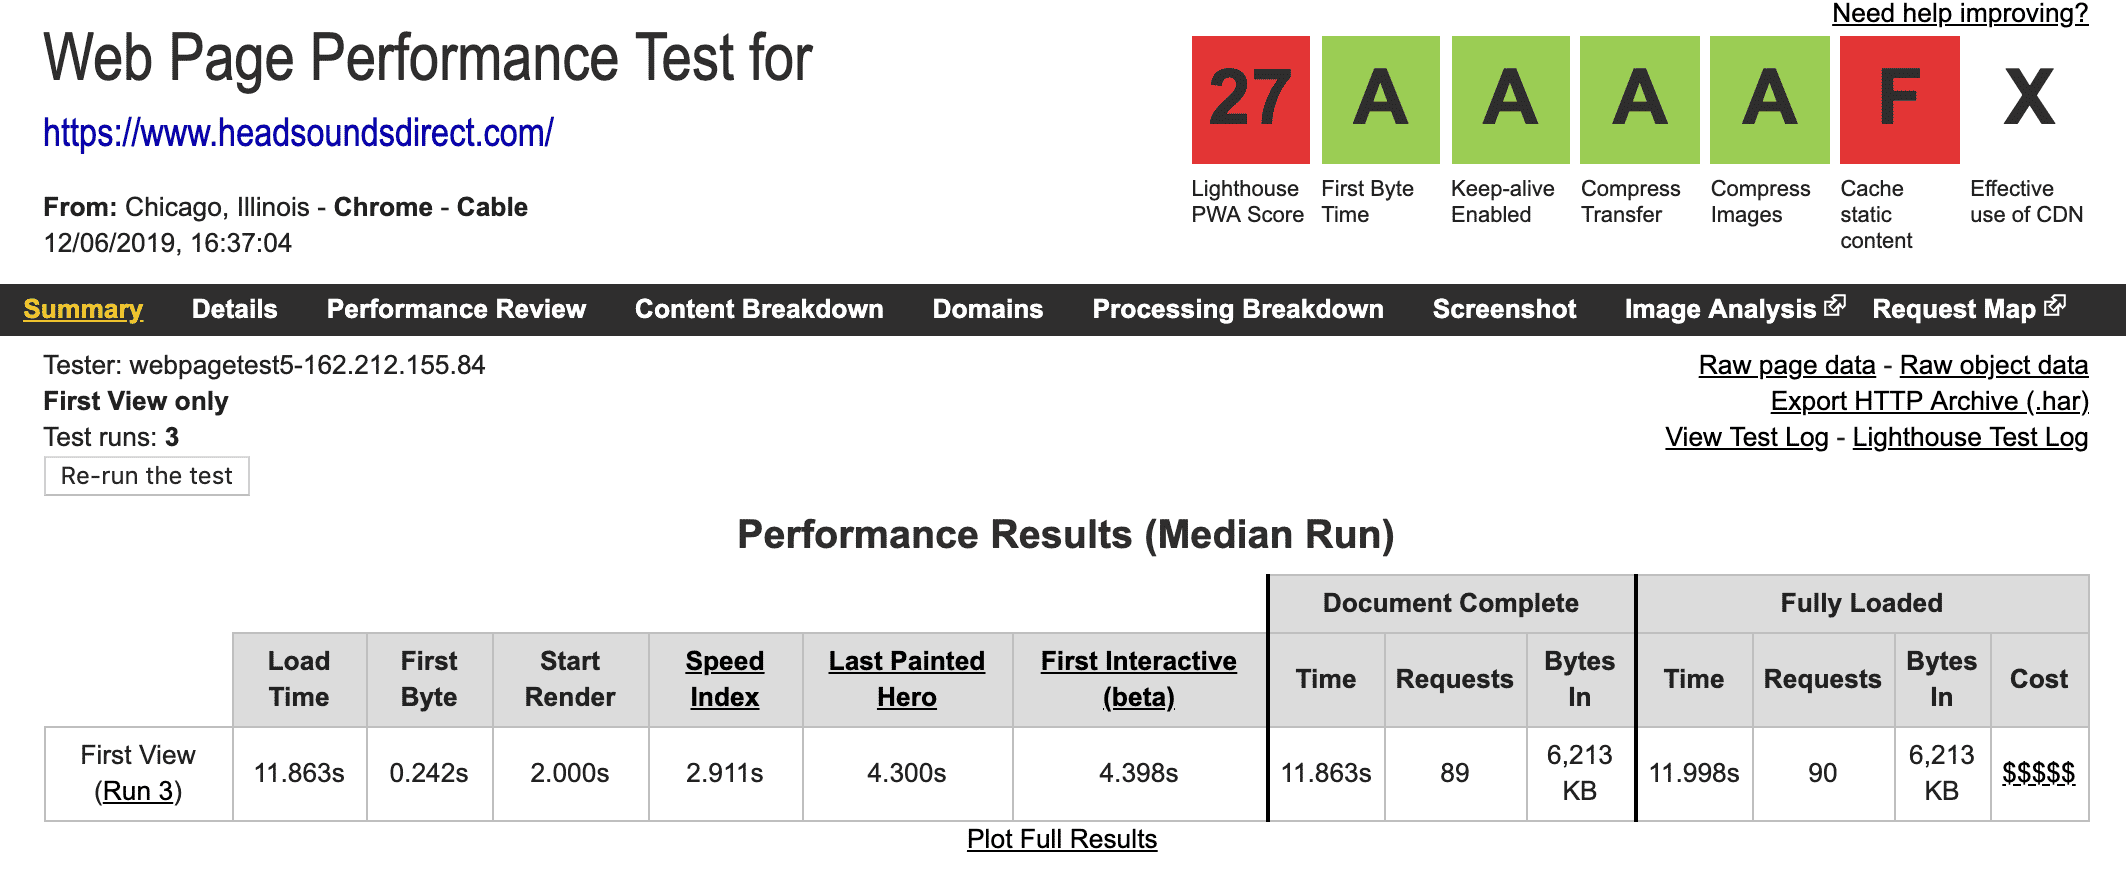
WPT Findings
- FLT of almost 12 seconds is shockingly poor. But I think is a much more accurate metric than what GTMX reported for a website weighing in over 6MB.
- Time to first bye (TTFB) of 242ms is excellent.
- First Interactive time (FIT) of 4.39 seconds – not great, not terrible…
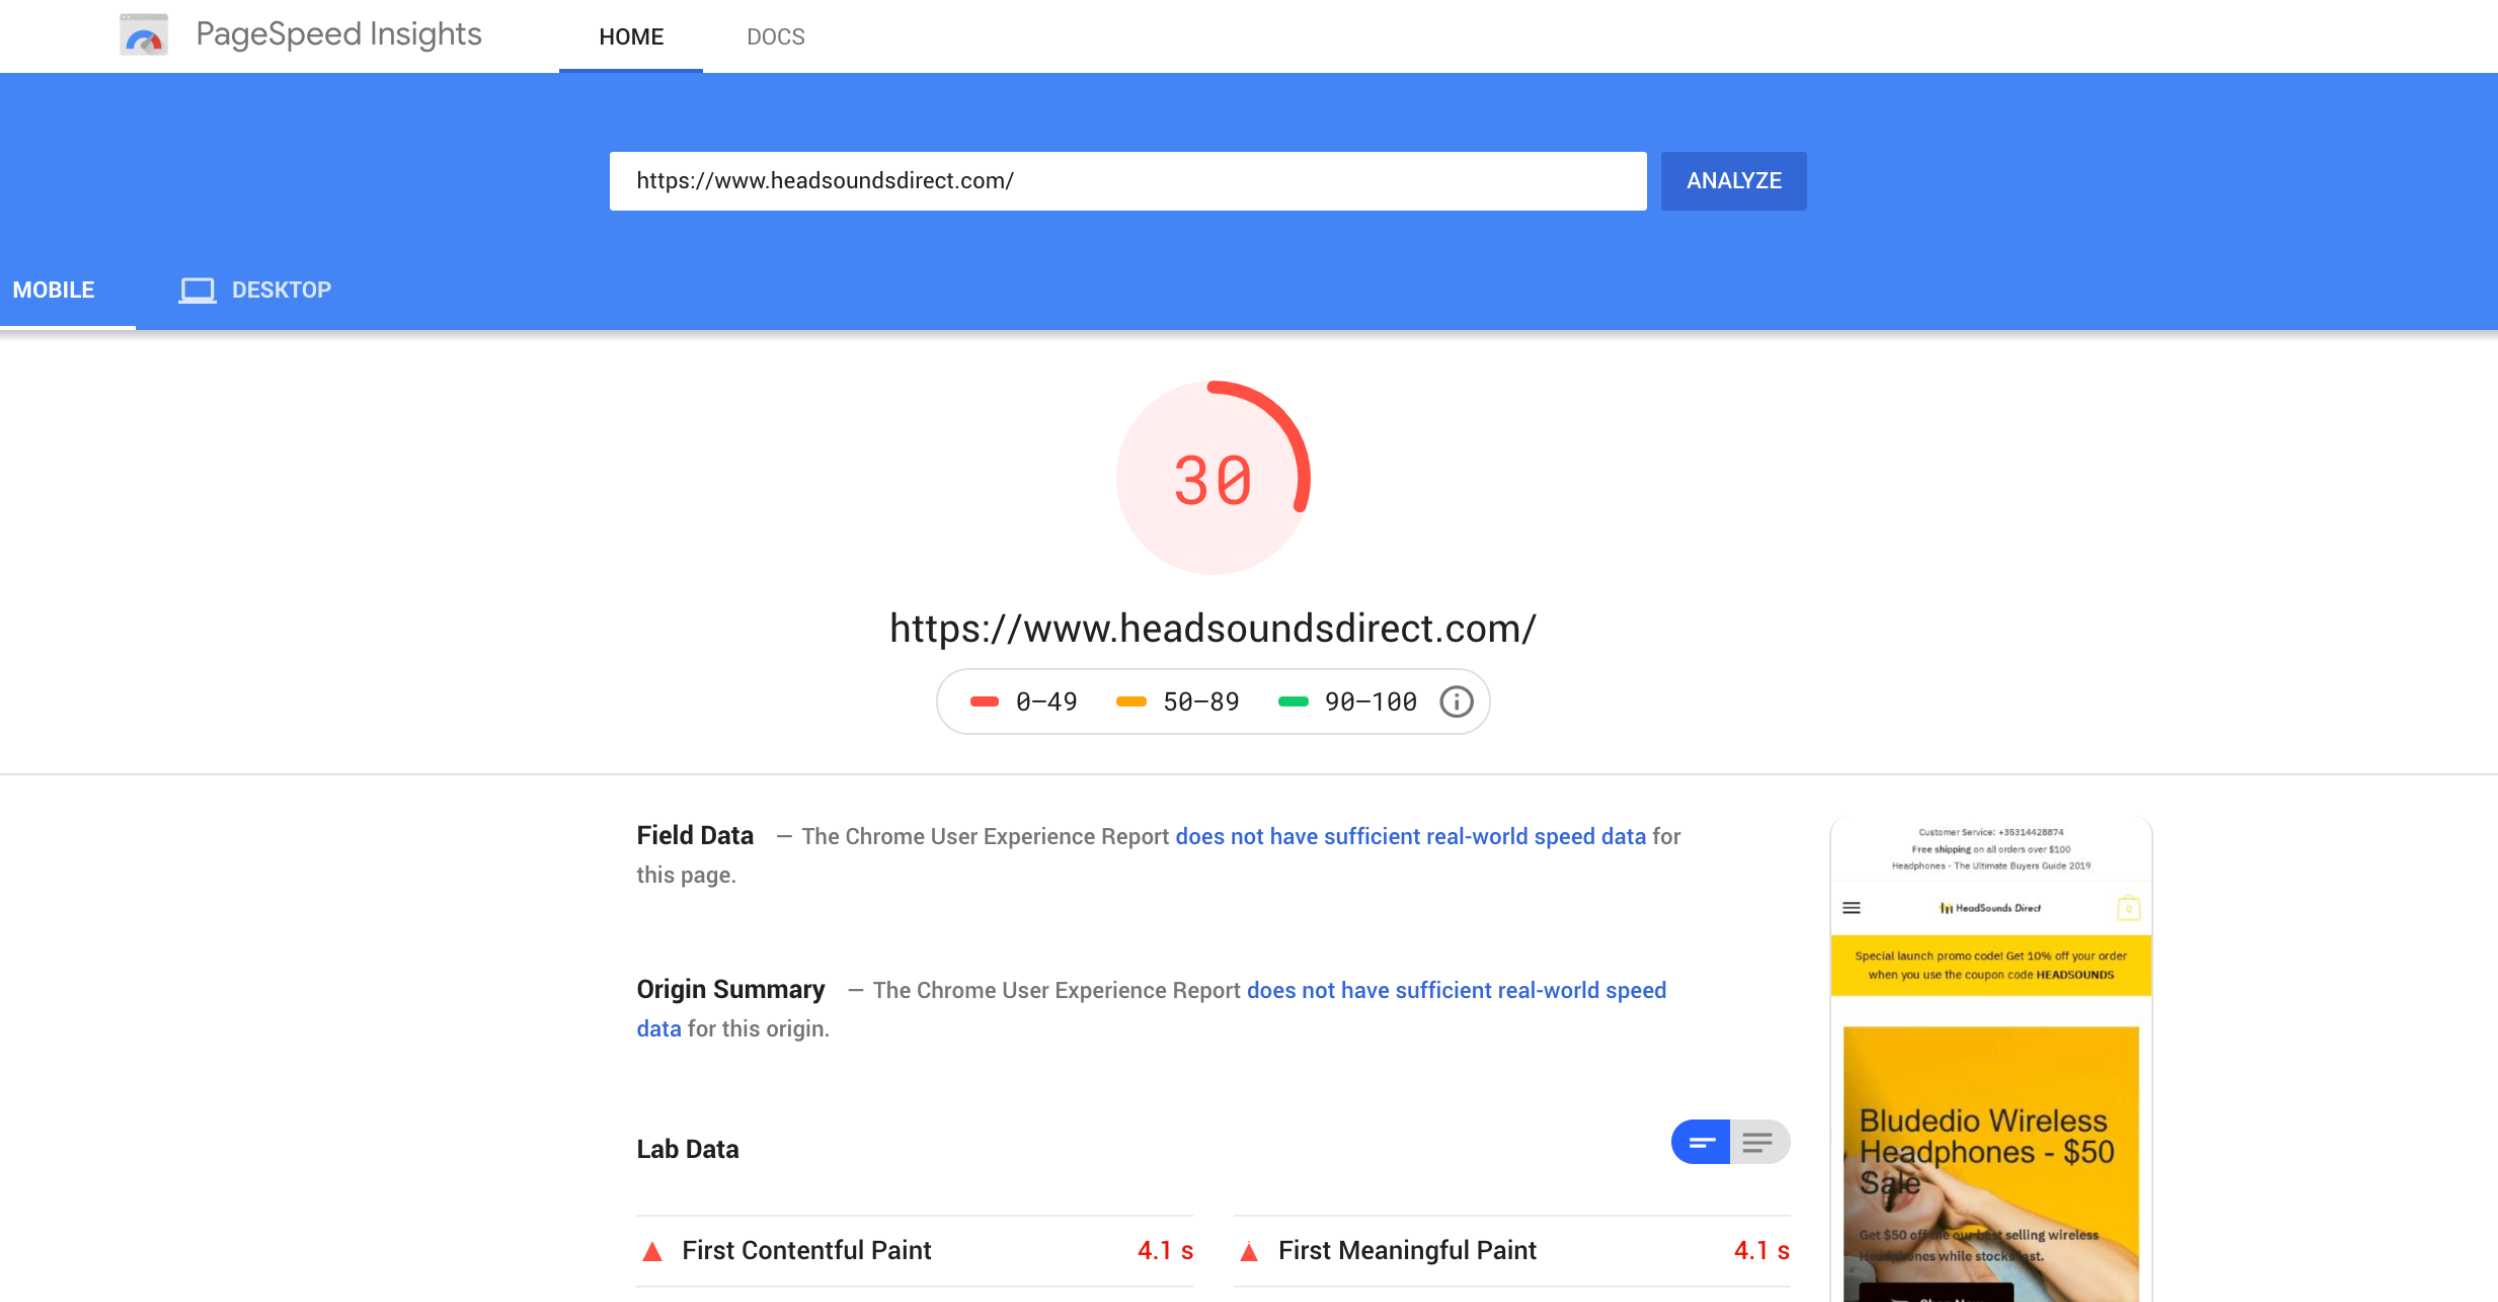
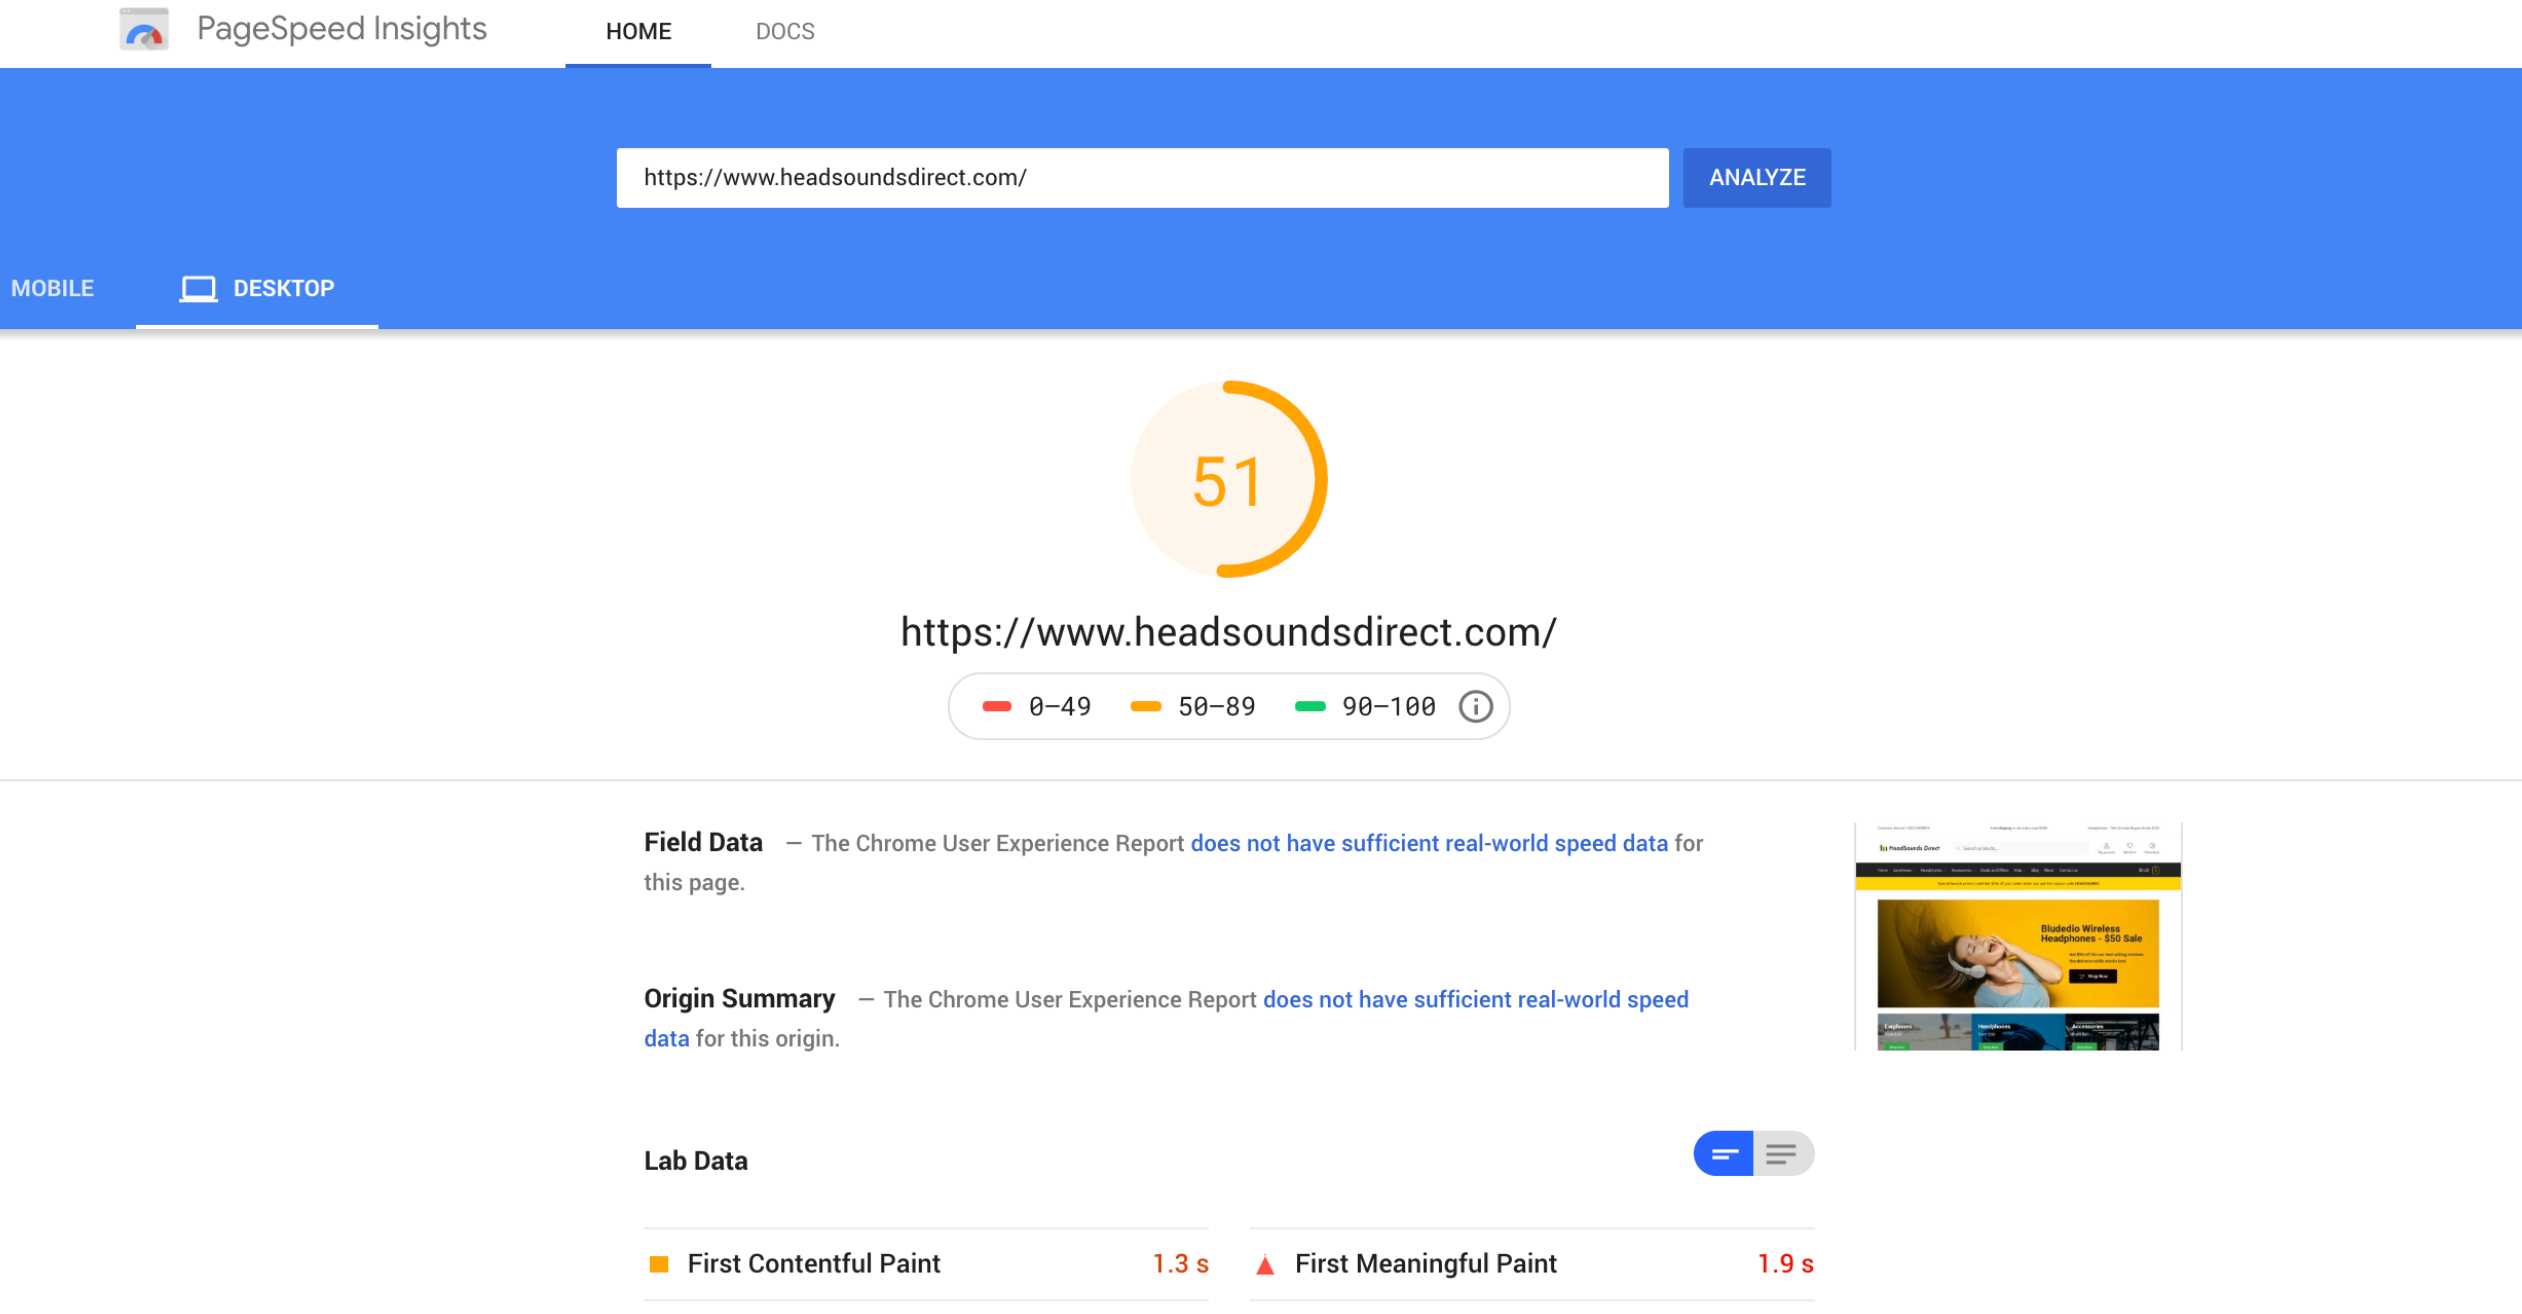
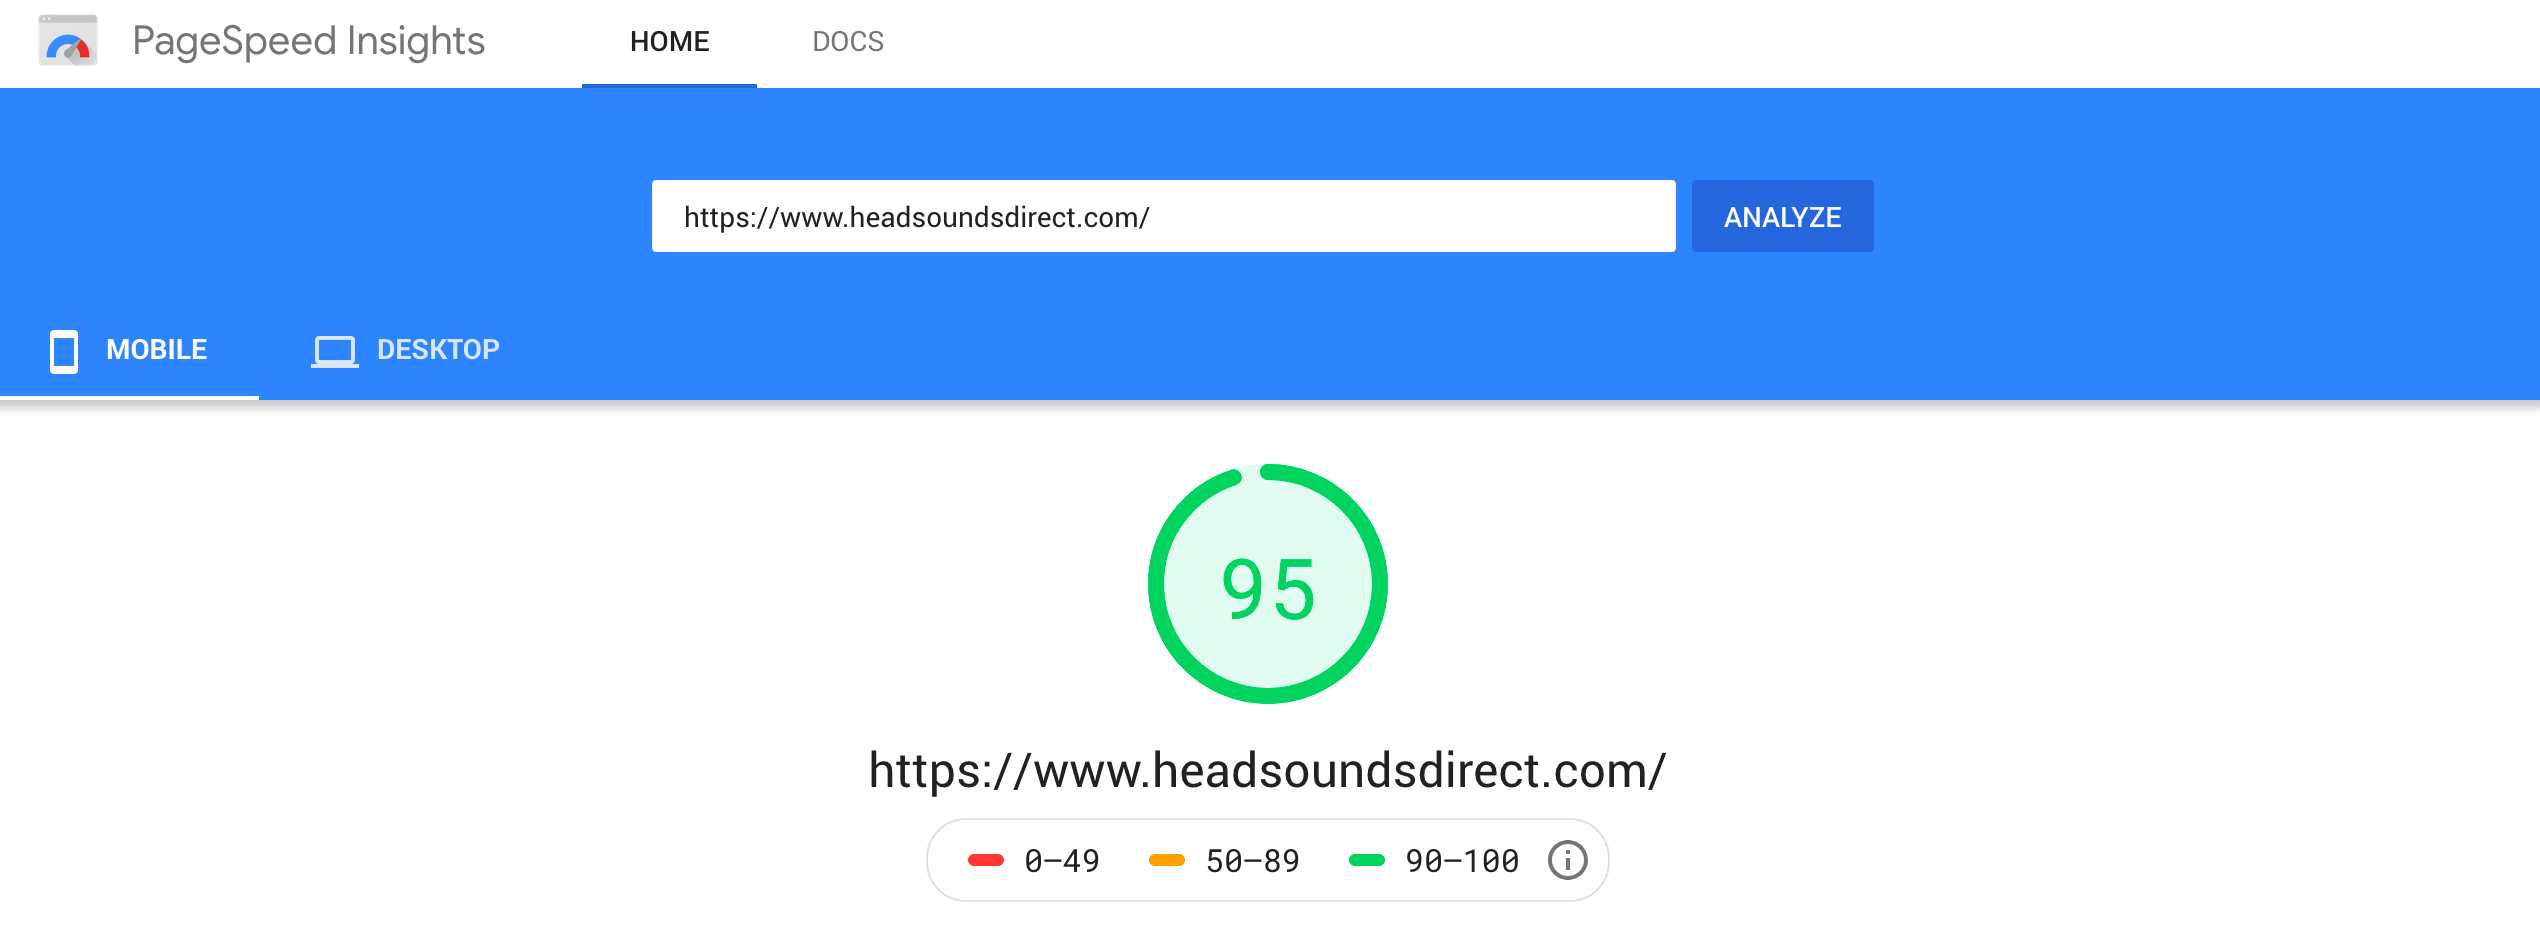
Google Pagespeed Insights Report
- Testing Location: Unknown – this isn’t something we have control over with GPSI (and important to factor into your tests if your website is hosted far away from the GPSI testing location. Check your server logs to see if you can spot the IP address of the GPSI test request which can help you factor in location latency).
- Device details: GPSI uses Lighthouse and emulates both mobile and desktop connections as part of its testing process.
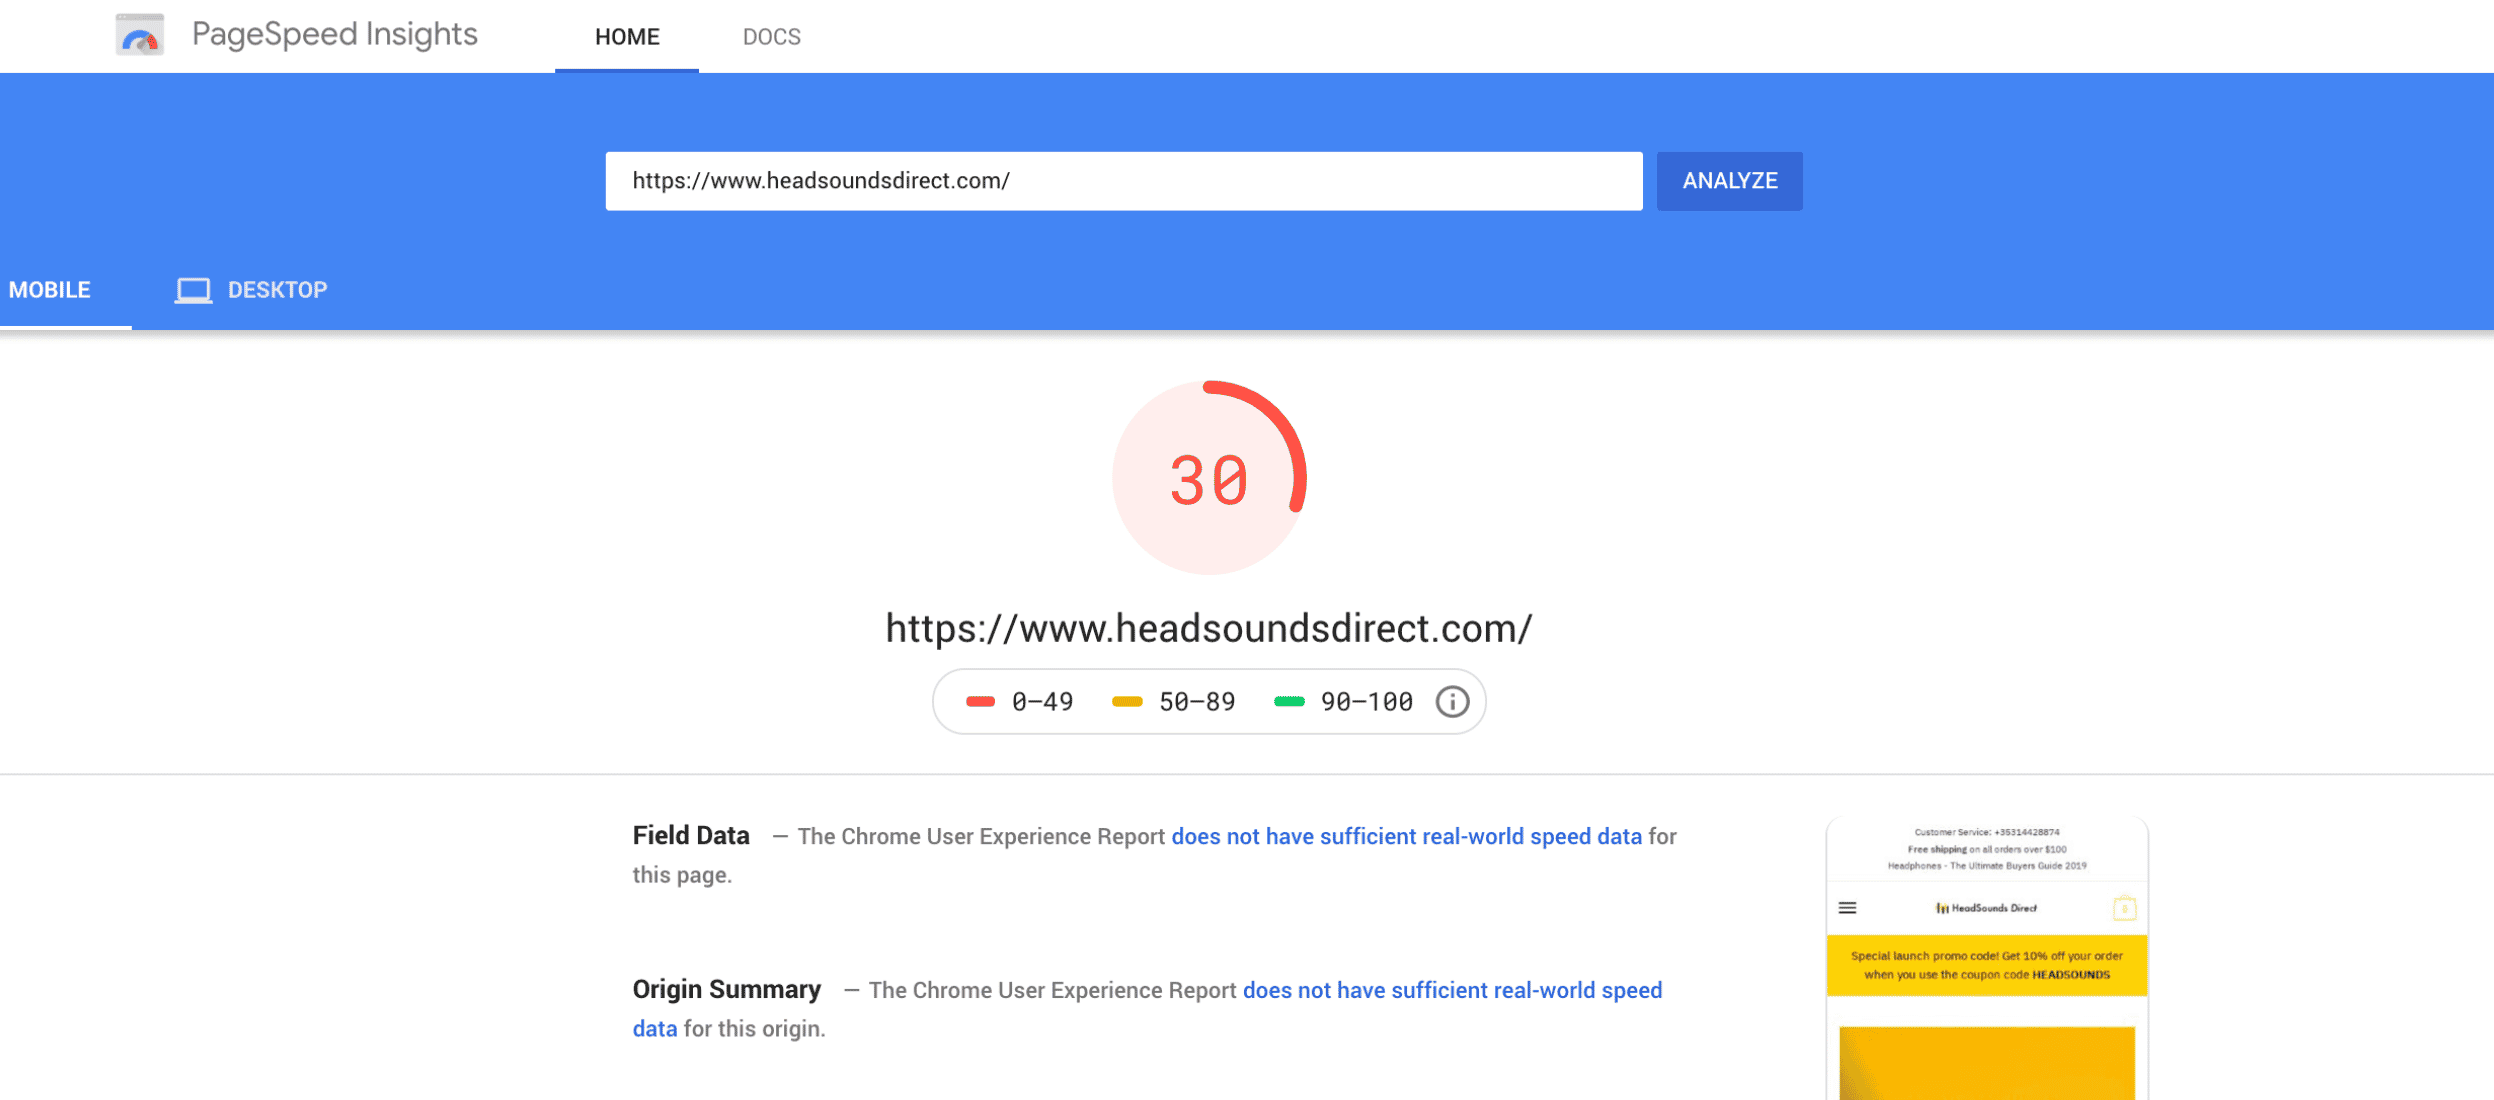
Mobile (default) score: 30/100
Desktop Score: 51/100
GPSI Findings
Note: no direct links to historical GPSI reports are available using GPSI itself (which is a shame). Also remember to wait 30 seconds between GPSI test runs as you’ll only see the cache of the previous test if you re-run the test any quicker.
- Mobile score: 30/100 – ouch! That’s not… good.
- Desktop score: 51/100 – I consider that to be pretty crap too considering how straightforward it is to improve the desktop score nowadays. For shame!
Speed audit – summary of findings
This is a pretty indicative of your average WooCommerce website before any major performance and speed optimization actions have been taken – hence why it’s a perfect case study for this guide. Before we do any kind of waterfall analysis, two things jump off the page that need to be sorted – the overall page size and the number of http requests. Both of those are way too high for a basic WooCommerce store. I consider those the low hanging fruit which we should be able to narrow in on quickly in Step 2 when we do a waterfall analysis.
WCPIP Step 2 – Waterfall analysis
NOTE: We won’t spend too much time here explaining how to read a Waterfall chart. GTMetrix has you covered with an excellent beginners guide.
Waterfall analysis can often be intimidating to beginners but they’re incredibly useful to help us identify speed bottlenecks with our websites. Think of a Waterfall chart as a blow by blow account of how the building blocks of a webpage are assembled. In practice it’s a bit more complex than that but it’s a good starting point.
Identifying the low hanging fruit
Most webpages are comprised of many smaller http requests. When conducting waterfall analysis we’re interested in the following:
- How many http requests are generated?
- Are the any http requests that we can remove completely?
- Which http requests take the longest to load?
- How can we speed up the slowest http requests?
So in summary we have two simple objectives in our initial waterfall analysis; remove any unnecessary http requests and speeding up our slowest remaining http requests. Quite often dealing with these two things has a dramatic impact on most WooCommerce websites.
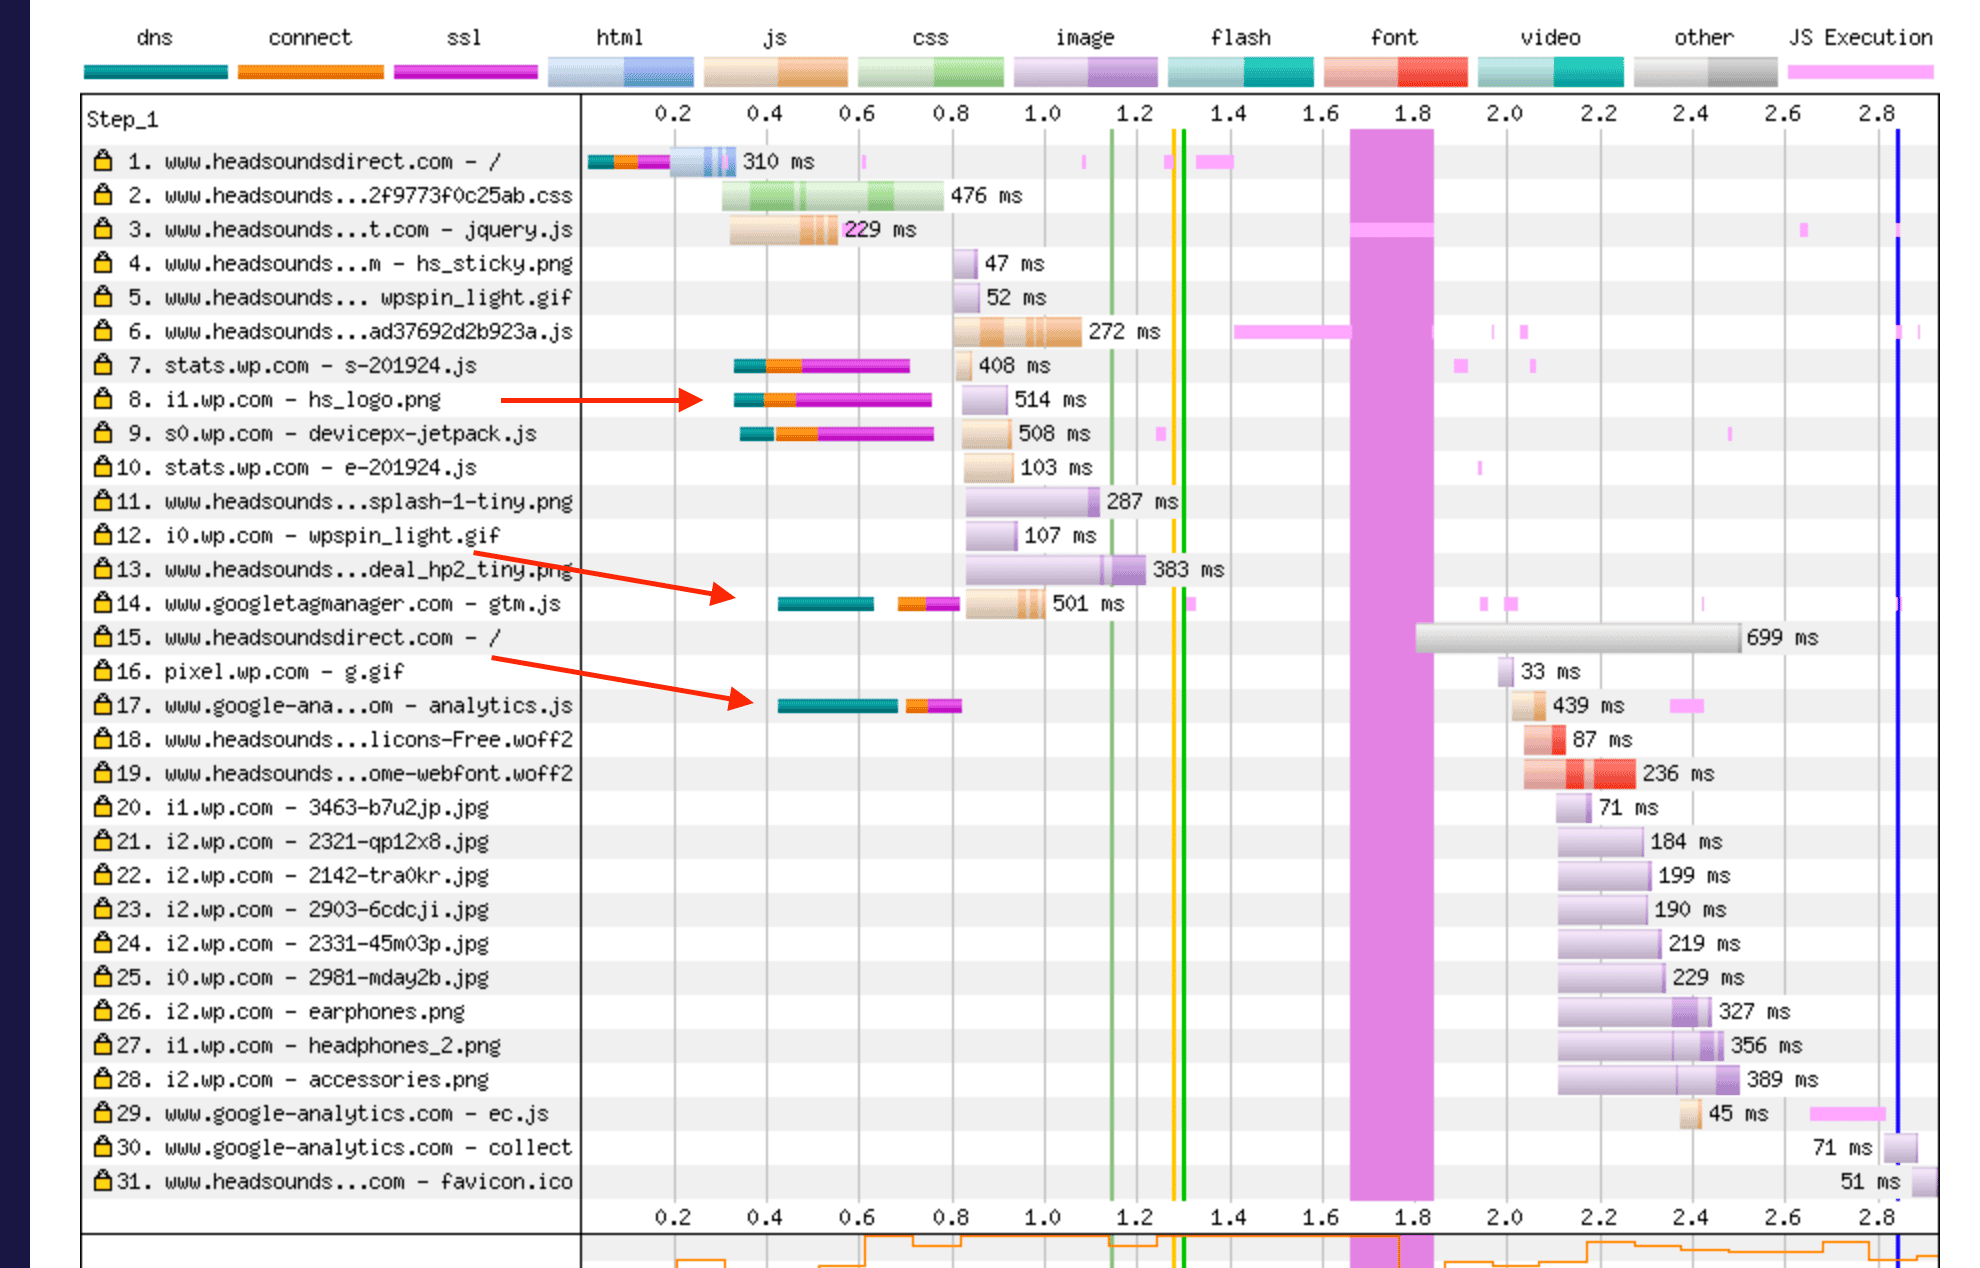
Let’s review the Waterfall chart for HeadSoundsDirect.
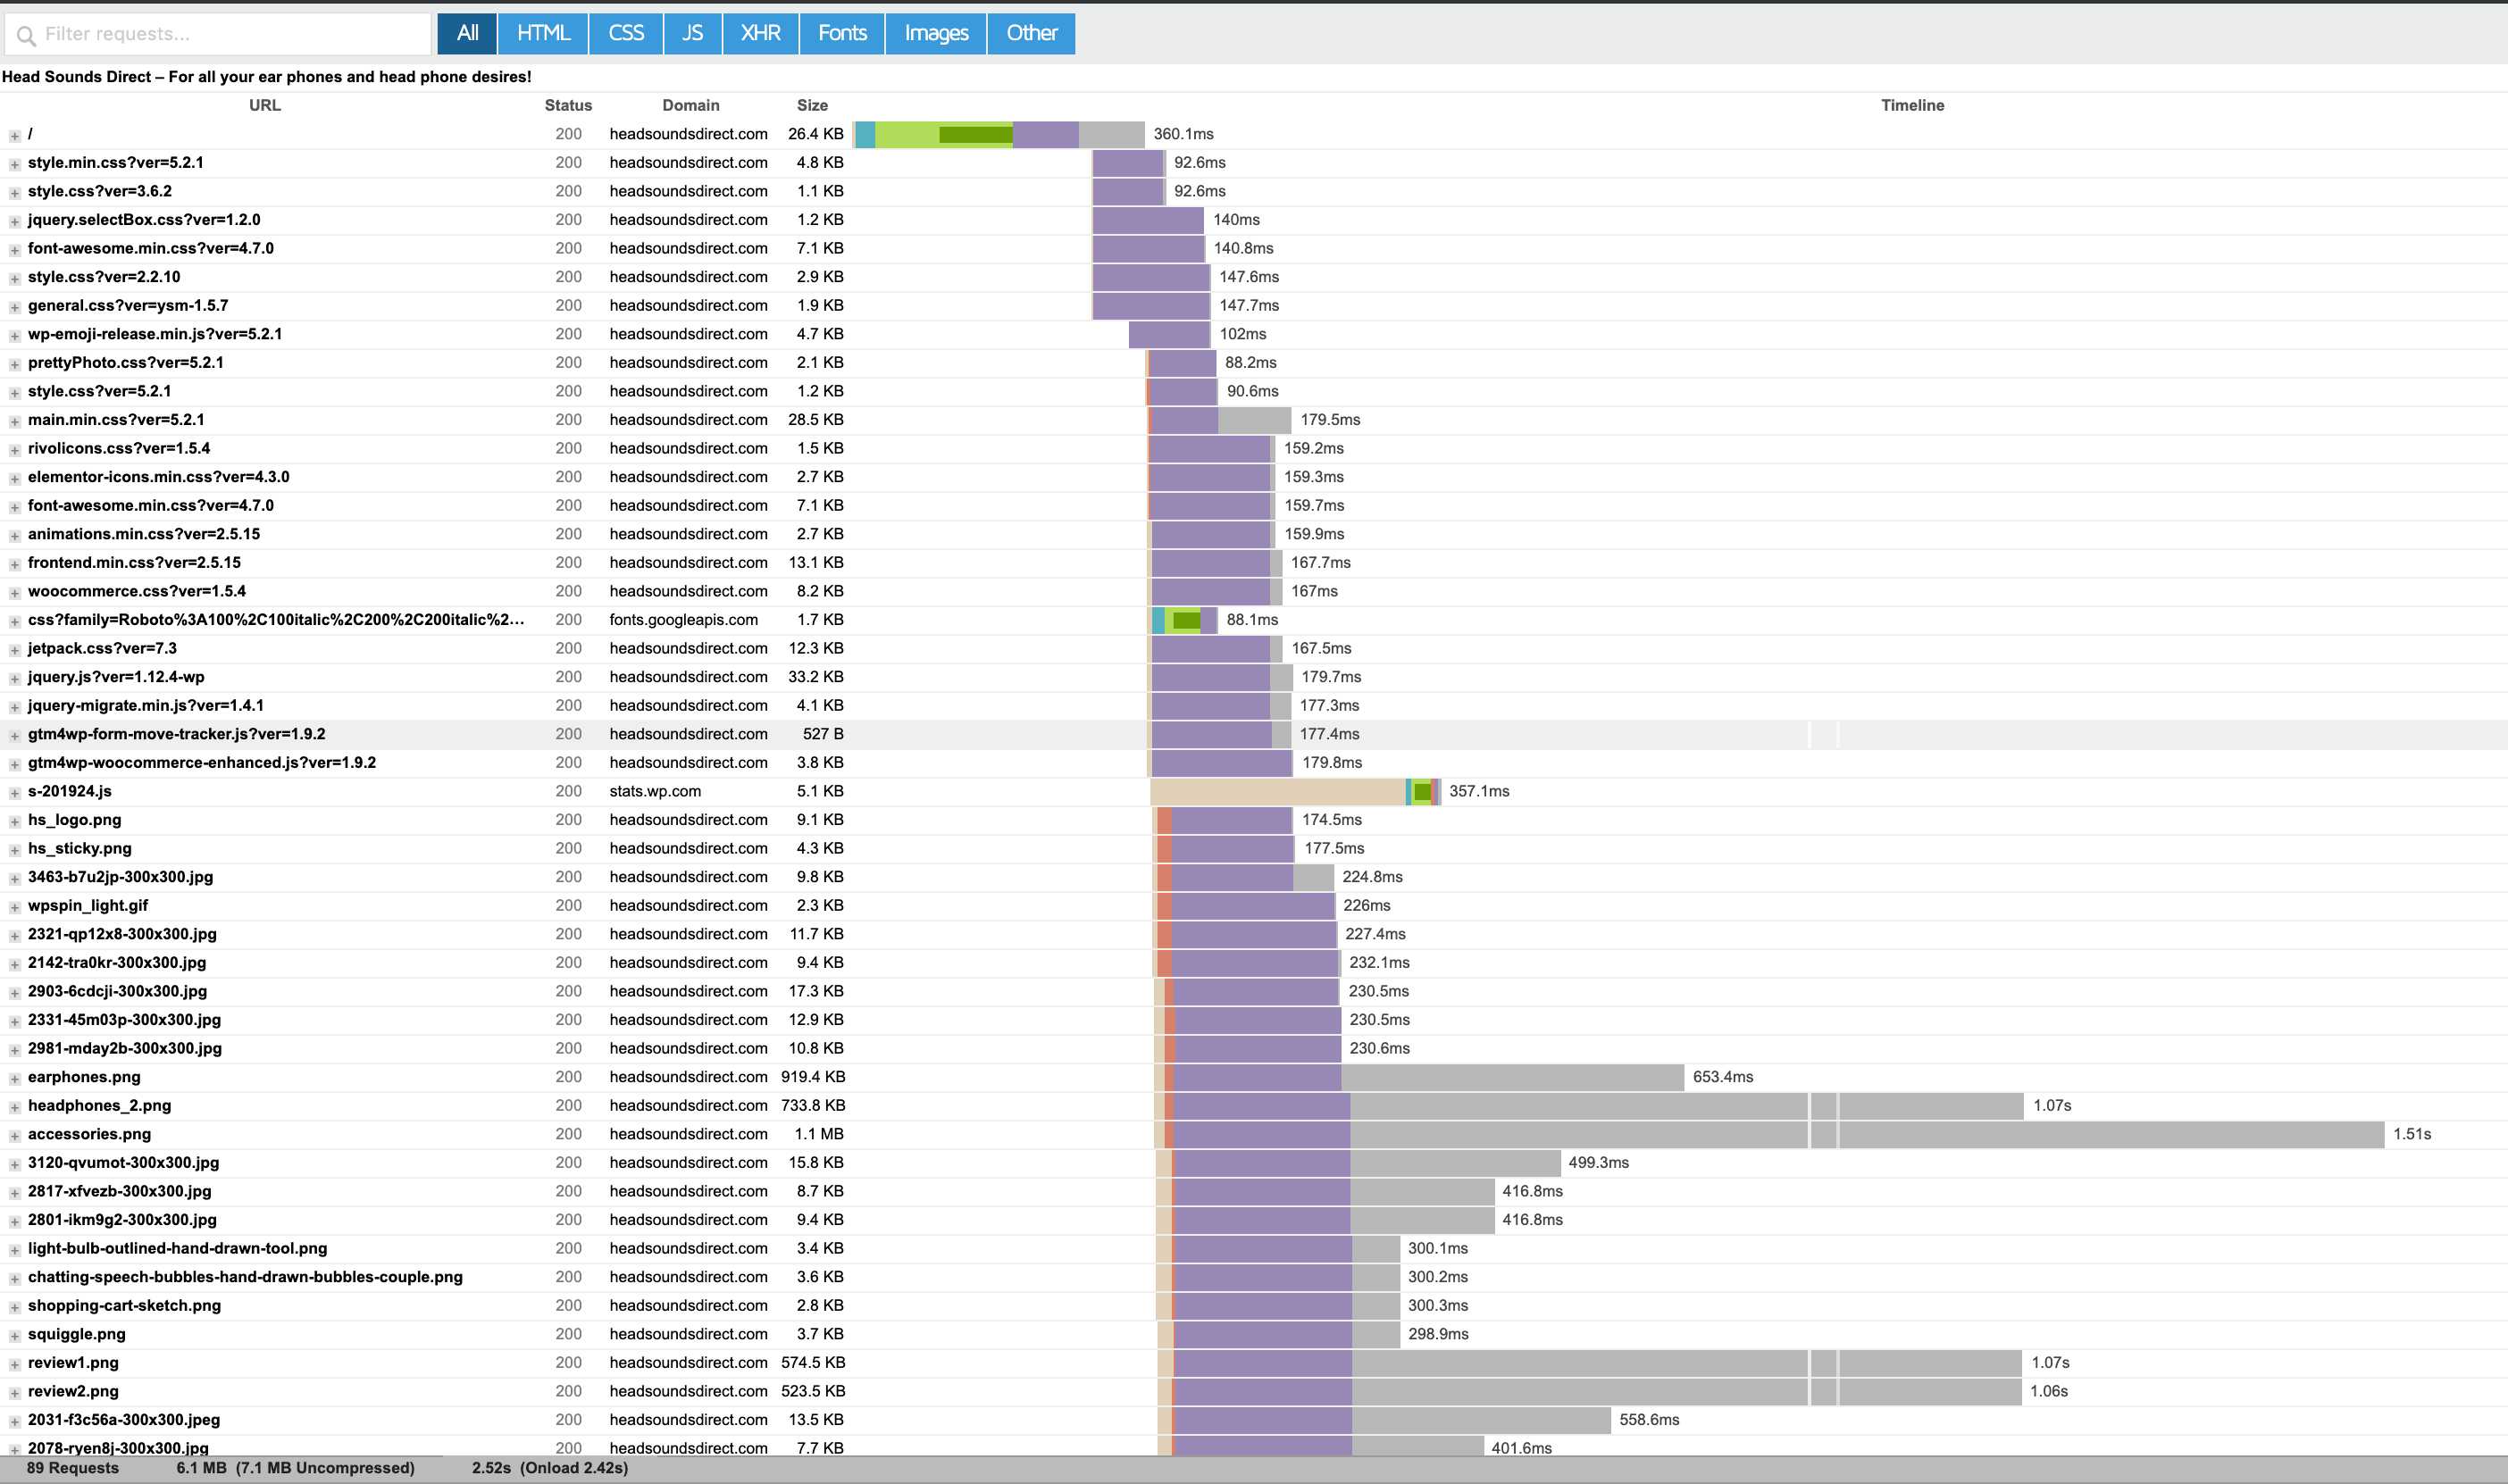
A forensic analysis of the first request – Request 1 – the main HTML document
We’re going to dive down a rather deep rabbit hole now and take a forensic look at exactly how our main HTML document loads. This is a valuable exercise as once we do it for one request you’ll be able to understand what is going on with every other request in the chart. Request 1 is a special type of request as it’s almost always the main HTML document – which can be a big bottleneck on WordPress and WooCommerce websites. Let’s take a closer look.
Request 1 took a total of 360ms to load. If you open the full waterfall chart and hover over Request 1 you’ll see the breakdown of 360ms as follows:
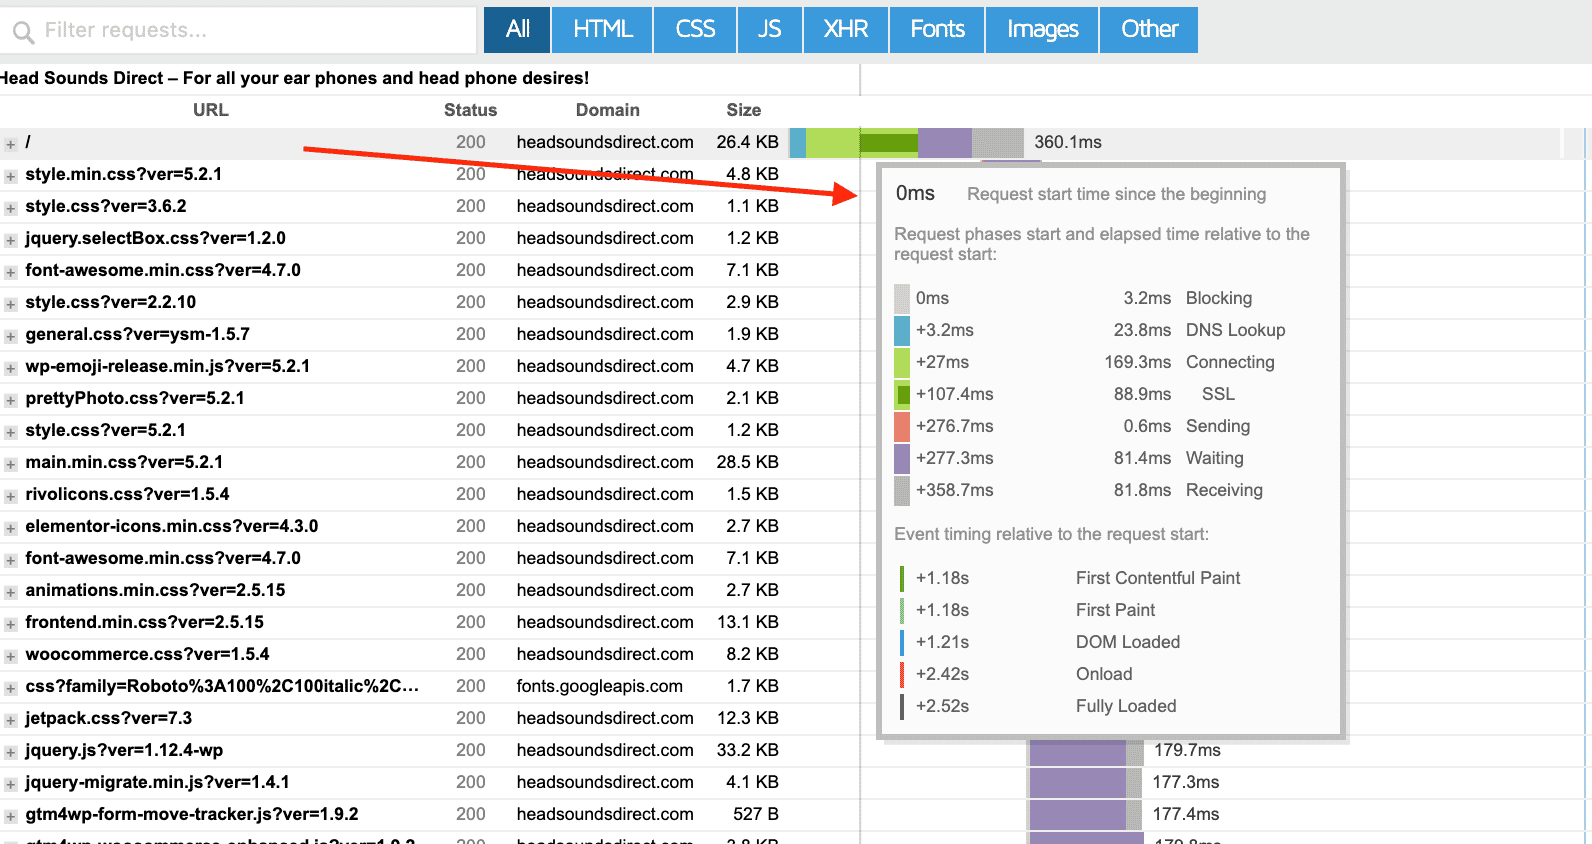
I’m pretty happy with the load time for the main HTML document. Let’s break down what each part of the request time means.
Blocking: 3.2ms
This is the time the request spent waiting in the browsers queue to start the request. Typically for the HTML document this should only a few milliseconds as it’s the very first part of the request.
DNS Lookup: 23.8ms
This is the amount of time our browser and operating system can figure out the IP address for the our domain name. 23.8ms is a solid time for that part of the request. There’s no reason in 2019 for DNS lookup times to be slow. If your DNS lookup times are slow you should consider using a dedicated, reputable DNS host. As someone who has hosted their own DNS servers for years I have some simple advice – DON’T even think about rolling your own DNS servers! I would also avoid using your domain name registrars DNS servers as they’re generally not as reliable or as fast as a specialized DNS hosting provider. Some of the better DNS hosting options include:
- Cloudflare – free, reliable and some of the fastest DNS servers on the planet.
- easyDNS – Starts at $20/year – been around a long time and solid as a rock.
- Amazon Route 53 – hard to argue against using Amazon infrastructure for DNS. Can end up being more expensive than alternatives but comes with nice bells and whistles if you host on AWS.
Connecting: 169.3ms
This is the amount of time needed to complete a TCP (network) connection between the web server and our browser. At 169.3ms it’s the slowest aspect of our initial request. 169.3ms is decent but this could be faster. HeadSoundsDirect is hosted on a low powered Digital Ocean VPS so we could easily improve the TCP connection time by upgrading to a more powerful machine in the future. It’s not a concern right now as it’s a satisfactory time for now – we’ve got bigger fish to fry 🙂
SSL: 88.9ms
This is the amount of time needed for the web server and our browser to complete a secure handshake to allow all data transfer to be encrypted. 88.9ms is a very respectable time for this part of the request. In the not too distant past the SSL handshake could be a real bottleneck. It still can be depending on what type of cert you’re using and it is configured – so keep a close eye on this one.
Sending: 0.8ms
This is the time it takes for the browser to send the request to the server. Typically this should be quite fast but if you’re uploading a file or if you’re on a very slow internet connection your sending time will be higher and is your fault 🙂
Waiting: 81.4ms
This is the time the browser is hanging around waiting for the server to send a reply. This is a REALLY REALLY important part of the request for our HTML document. In fact it’s the main reason I even bothered to go down the rabbit hole of explaining each aspect of the Request 1 timing.
I’m extremely happy with a time of 81.4ms. This tells me that my HTML document response is being generated almost instantly – which confirms that my page caching is working properly. (More on that in a moment).
For many WooCommerce beginners this is the biggest bottleneck in their waterfall. It’s not uncommon for the Waiting part of this type of request to be anywhere from 250ms – 4000ms. When I run GTMetrix on a WooCommerce website this is the first thing I look at. If I see a long waiting time on the HTML document this usually tells me this is a WooCommerce store that is running without full page caching. Full Page Caching is an absolute must to speed up your WooCommerce store. To give you an idea of just how important Full Page Caching is, take a look at this.
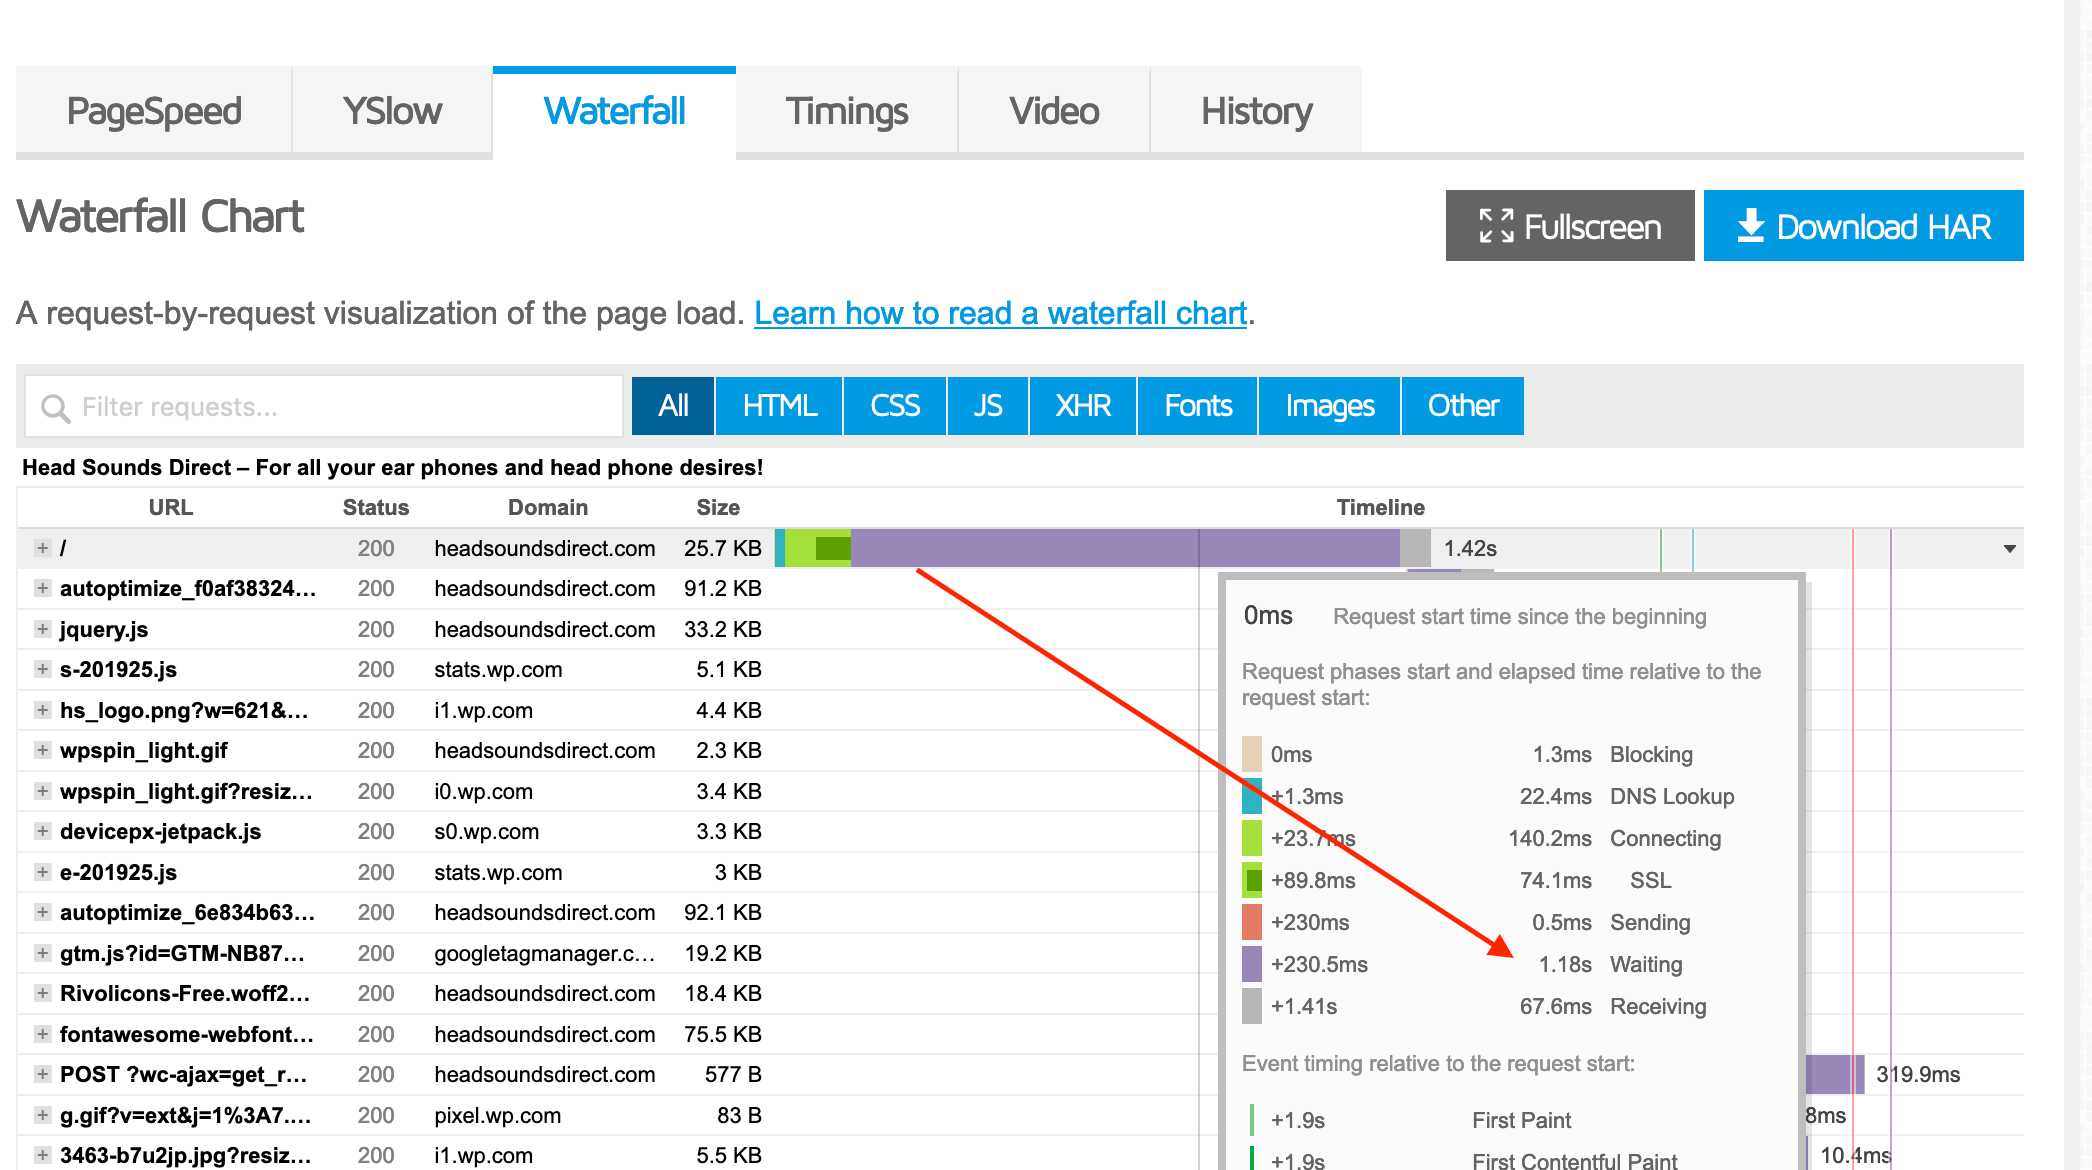
This is a Waterfall chart for HeadSoundsDirect when I switch our full page caching layer. Notice how much further to the right our HTML document request is? Our waiting time went from 81.4ms to 1180ms! (1.18s)
81.4ms is an exceptionally fast time for our waiting time. This is largely thanks to the fact that we use Cloudways to host HeadSoundsDirect. Cloudways has spent a lot of time configuring Varnish Cache to play nicely and help speed up WooCommerce significantly – which is not for the faint of heart!
Varnish Cache is the wicked fast caching server used by many of the world largest websites. Varnish is one of only two methods I recommend for implementing full page caching with WooCommerce. (The other being the also awesome nginx FastCGI/Microcaching.) Full page caching via Varnish or nginx microcaching will absolutely crush any other type of approach to caching WooCommerce every day of the week. Why? Quite simply, the markup for your webpages is stored and read from memory (rather than on disk – which is far slower – even with SSD’s).
Don’t get me wrong – there are some awesome WordPress and WooCommerce caching plugins like WP Rocket and WP Fastest Cache that implement their own caching layer – but these still need to utilise your web server at best – and at worst – your PHP backend. Varnish and nginx microcaching are purpose built to serve HTML without going near the more resource expensive parts of your hosting stack at huge scale.
So whenever possible make sure you’re using some form of Full page caching powered by either Varnish or nginx microcaching. All the major managed WordPress/WooCommerce managed hosts like WPEngine, Kinsta and Siteground use one or both of these for their caching layers (even though they sometimes like to rebrand them with their own fancy in-house brand name). It’s also the reason why they tell you not to use other caching plugins like W3 Total Cache or WP Super Cache on their platforms – they’re simply not needed.
At this point in the waterfall for request 1 we’ve just passed the first major metric that most web performance experts take a look at when conducting a speed audit – Time to First Byte (or TTFB).
TTFB is the total amount of time spent to received back the first byte of the first response from the web server once it has been requested by the browser. We know there’s evidence that Google has paid close attention to this number since 2010 – long before the recent mobile first index changes.
A slow TTFB is almost always tied to a slow Waiting time on the HTML document response – but not always. As we mentioned previously, slow SSL connection handshakes and slow DNS lookups can also contribute to a slow TTFB. This is why choosing a proven, high quality WooCommerce specialist hosting provider is so important to the success of your online store.
If you don’t want to spend a ton of time trying to improve your TTFB I highly recommend you just use Cloudways to host your WooCommerce website. If you’re interested in reading more WooCommerce hosting recommendations be sure to check out our WooCommerce Hosting Guide.
The final number in Request 1 is Receiving: 81.8ms. This is simply the time taken for the HTML document to be downloaded by your browser. This time should always be pretty nippy if you’re on a decent internet connection. The main thing to watch out for here is the size of your HTML document. In our case this is 26.4kb which is nice and light. If your HTML document size is pushing 100kb and over you’ll need to take a closer look at it to see why it’s so big.
Now let’s jump back out of this rabbit hole and take a look over the rest of our waterfall chart.
Waterfall http request analysis
We have a total of 89 http requests which break down as follows:
- 17 CSS files
- 31 JS files
- 10 font files
- 29 images
- 1 ajax request
How many http requests is too many?
There’s no simple answer to this question – other than try to minimize the number of http requests your site generates. Since the release of the game changing http/2, the quantity of http requests is less of an issue for your browser as requests are now packaged and downloaded in batches in parallel which speeds things up massively. (with http 1.1 requests were downloaded one at a time). So don’t be surprised if you read conflicting advice about whether you should serve one big CSS file or lots of small ones. If your host supports http/2 (and it really should by now!) then conventional logic says I shouldn’t worry about the 17 small css files I currently have.
And yet, I know from experience, that my GPSI scores go up once I start to combine these smaller files into one bigger file! So for now, my advice is to concatenate your CSS and JS files – even if this flies in the face of http/2 best practices. Remember, we’re ok with promoting actions here that help our GPSI scores as long as they don’t hurt our overall load times.
So we’re going to try to concatenate and minify all 17 CSS files and 31 JS files into just 1 CSS and JS file.
10 font files also seems excessive. Font files can be particularly troublesome as the are usually render blocking and have a big impact on the page look and feel. We’re going to see if we can remove as many of them as possible.
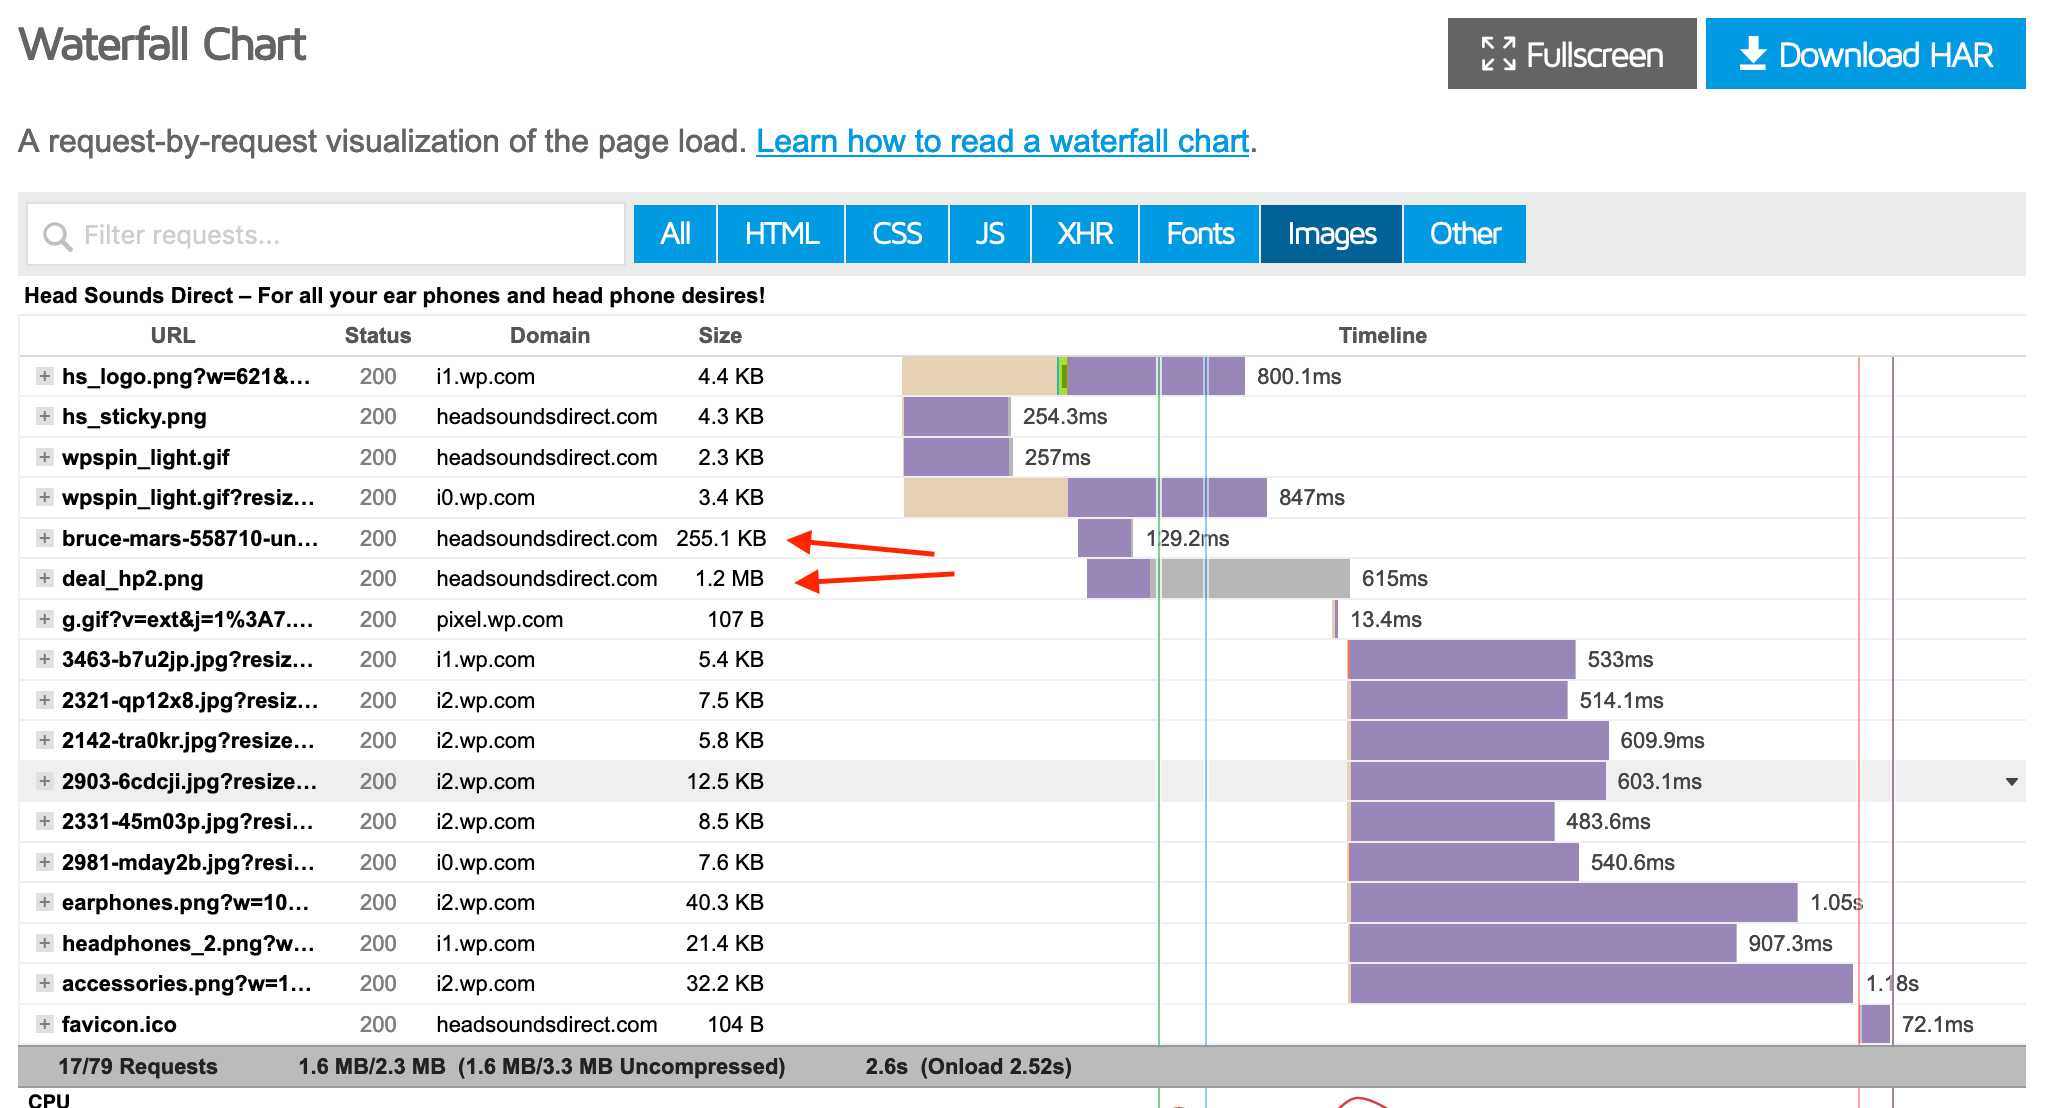
29 images isn’t excessive for an eCommerce website homepage (Look at how many images you see on Amazon.com). But what is excessive is just how big they are – they’re massive!
This is where our Waterfall chart really becomes useful. Note just how long it takes to download some of our largest images.
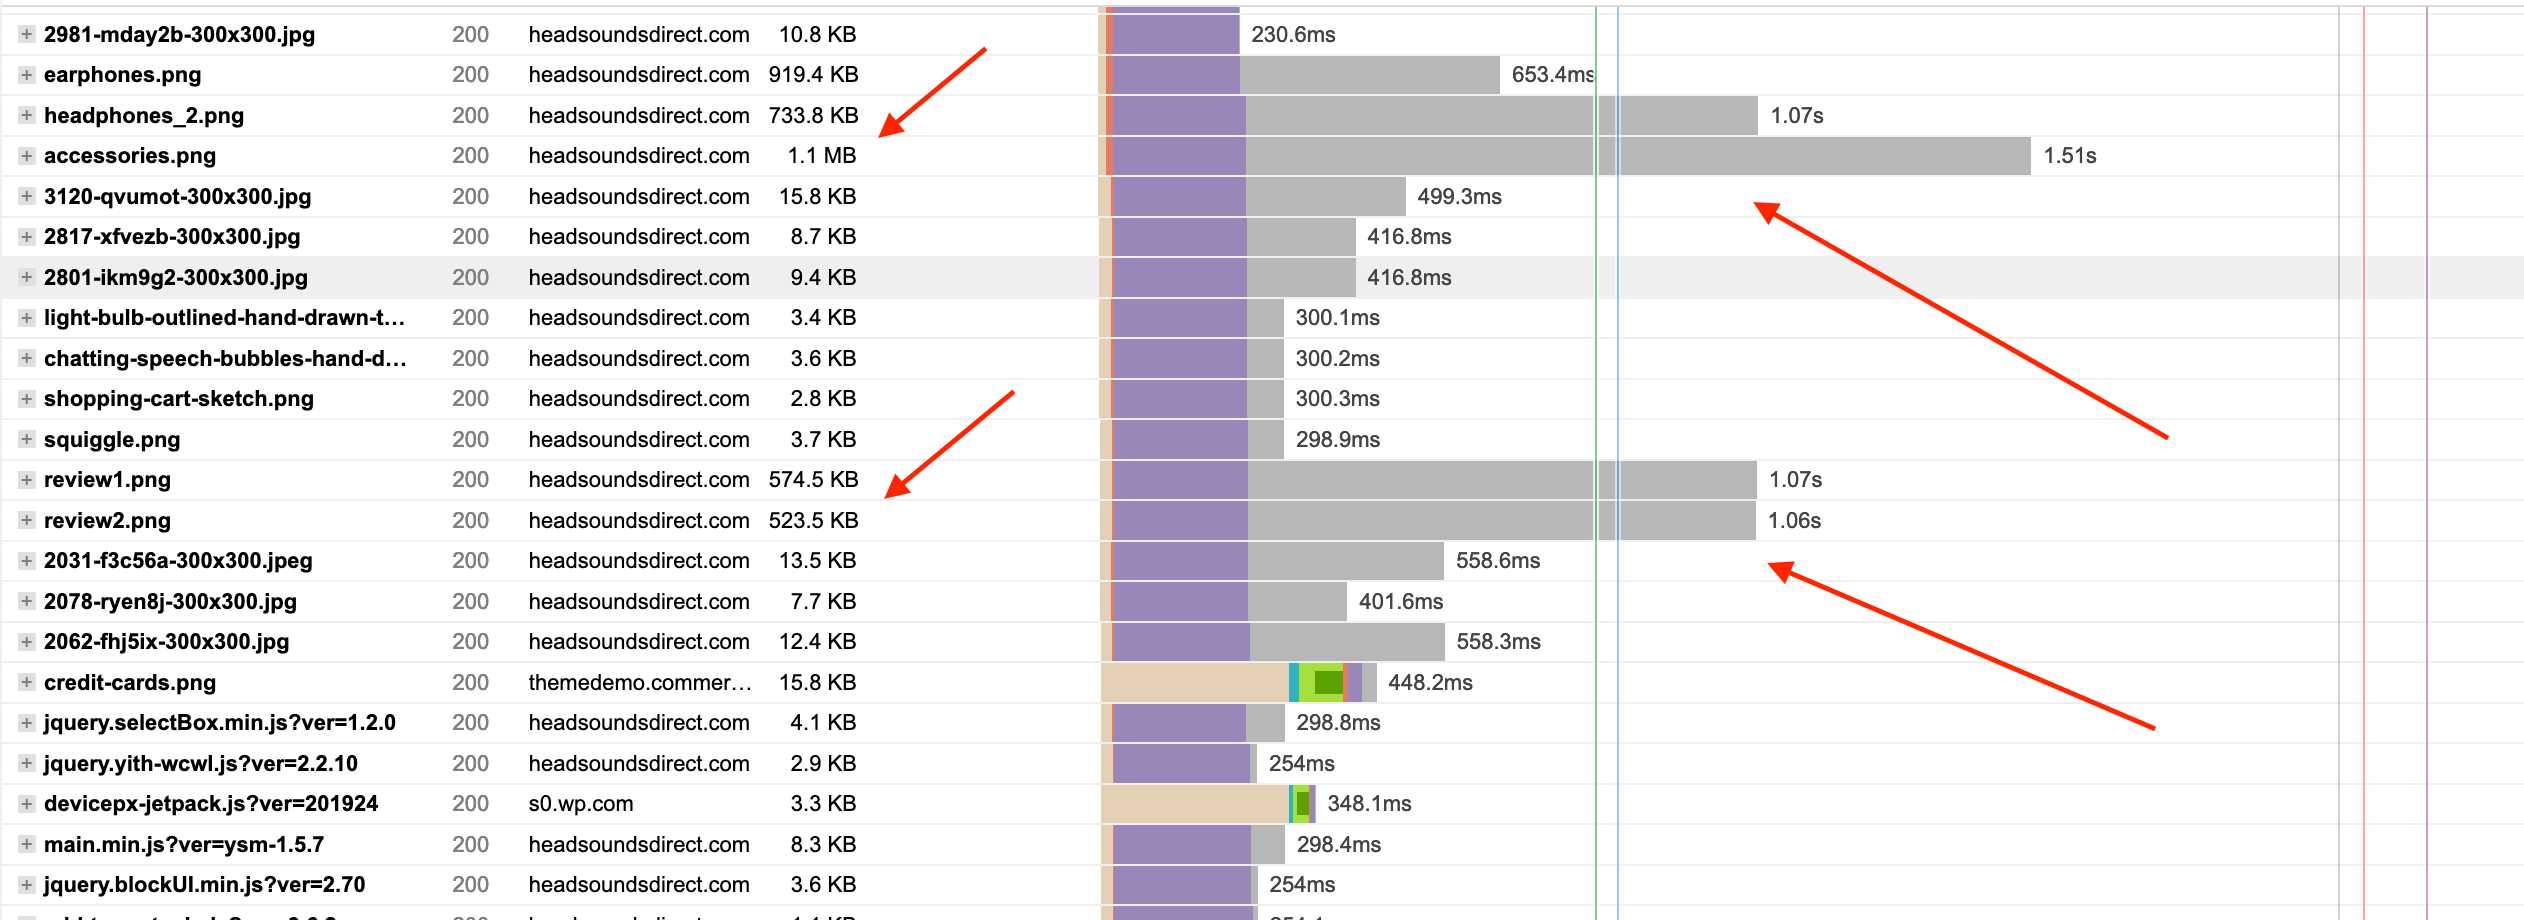
We’re loading over 5.4MB of images on our homepage! This is way way over the top. We’re going to look into optimizing our images significantly.
What about wc-ajax=get_refreshed_fragments ?
We’re stuck with that single ajax request for now.
If you click to expand the request details you’ll see it’s a WooCommerce ajax request to get our Shopping cart HTML called wc-ajax=get_refreshed_fragments
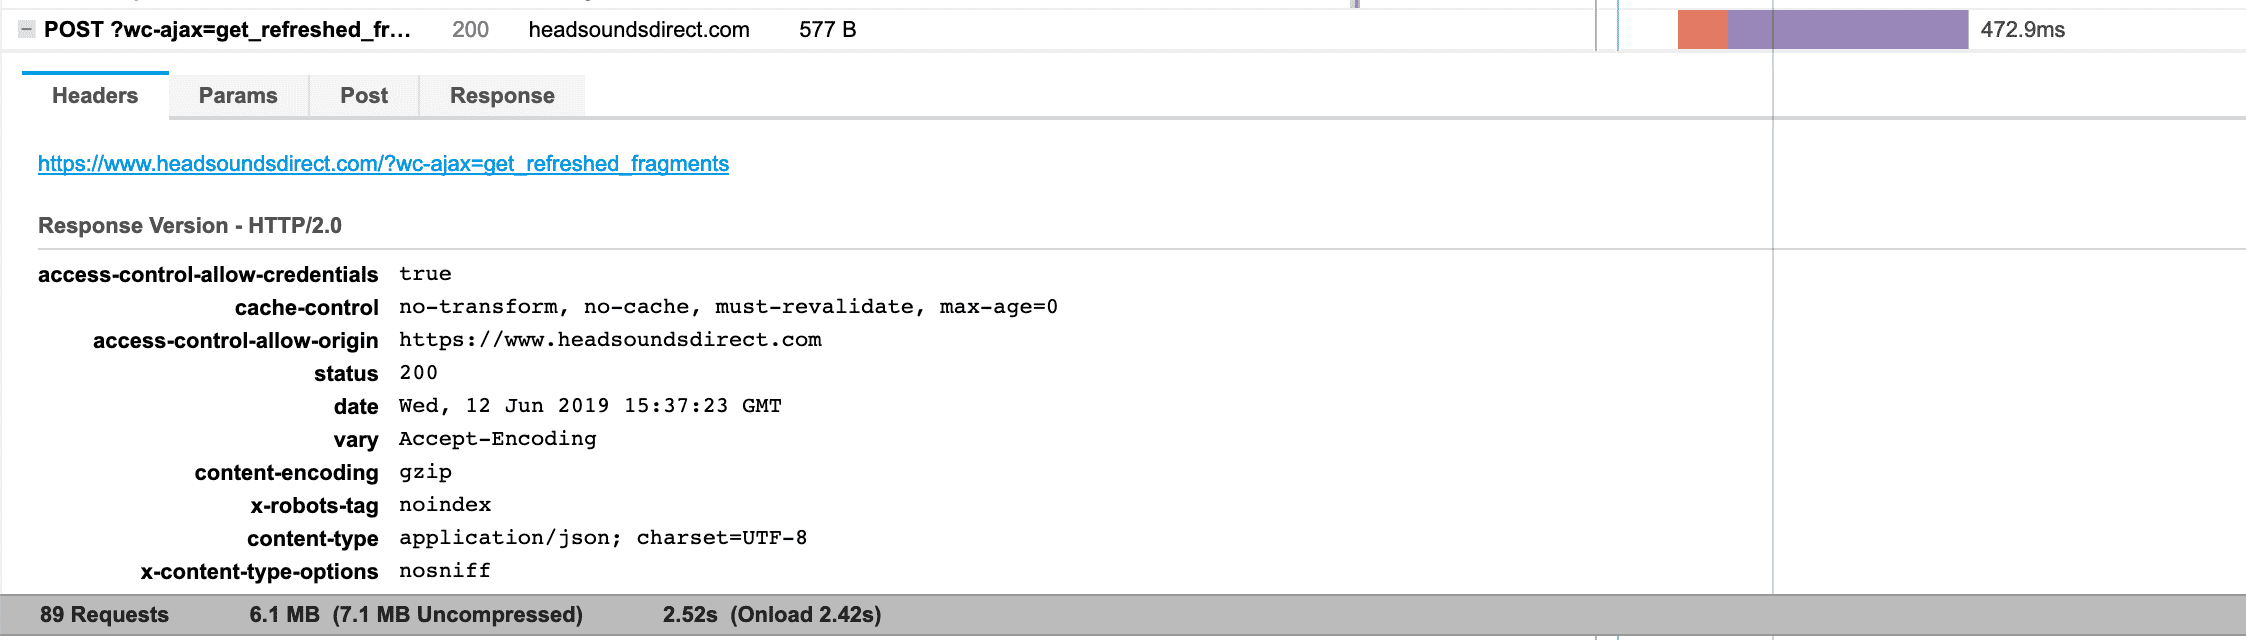
It’s also quite a resource intensive http request as it generates some database calls that we can’t cache. (Well, WP Rocket have a nice optimization trick for it and I’ve seen others use Varnish to cache the callback but I don’t recommend it). Some others advocate for removing the request – which is pretty easy to do, but can cause issues if your WooCommerce theme displays cart contents on pages other than your shopping cart (which is very common and a solid UX pattern). So again I don’t recommend it. While it does definitely extend the fully loaded time for your website, it doesn’t have a major impact on your GPSI scores as the request takes place well after the First Contentful Paint (FCP) and is non-blocking.
Waterfall analysis – summary of findings
The set of low hanging fruit actions for us to implement in Step 3 is now quite clear:
- optimize images
- concatenate and minify CSS/JS files
- remove font files
It should also be pointed out that I did manage to avoid some of the most common sins we see with slow loading WooCommerce websites by using a good quality WooCommerce webhost and a fast WooCommerce theme 🙂
Once we deal with the low hanging fruit we can move on to more complex optimizations.
WCPIP Step 3 – Implement speed improvement actions
So let’s dive in and start kicking HeadSoundsDirect into shape! We’re going to tackle each action in order of what I know has the highest impact on our load times and GPSI scores to speed up WooCommerce quickly with the last amount of effort..
Optimize Images
Without question, our images are our single biggest bottleneck right now. The good news is that there is no shortage of image optimization options for WordPress and WooCommerce. Over the years we’ve tried them all 🙂 Generally almost all image optimization plugins and extensions fall into 3 categories; Self-hosted, SaaS/subscription based services and CDN based services. Let’s take a look at the pros and cons of and best options for each.
Self-hosted WordPress/WooCommerce image optimization plugins
With self-hosted WordPress image optimization plugins, image optimization usually takes place on your own servers. Pricing for self-hosted image optimization plugins range from free to recurring annual charges. Some services also offered metered based pricing where you pay a price per image optimized.
Pros
- No reliance on external services. For some this is a big one. Some people have an aversion to using external services for commodity tasks like image optimization.
- Lots of free options and low/one off cost options available.
Cons
- If you have a lot of images in your WooCommerce website, batch optimization using a self hosted options can quickly gobble all your server resources.
- Some plugins take a good bit of time to configure server libraries required for optimal image optimization.
Top picks for self hosted Image Optimization
- EWWW Image Optimizer – One of the original and oldest WordPress image optimization plugins. With over 700,000 active installations and a ton of configurability, EWWW remains a solid option if you’re comfortable spending some time configuring your machine with the right image libraries for best results. Watch out for server resource usage with this one on larger WooCommerce websites.
This is pretty much the only self-hosted Image Optimization plugin I trust at this point. I don’t generally recommend using self-hosted image optimization plugins because of their image on server resource usage – but if that’s not a concern for you then look no further than EWWW.
A better ‘self-hosted’ option is to consider optimizing your images BEFORE they ever go near WooCommerce. This is my preferred approach for new WooCommerce stores. On macOS I highly recommend using ImageOptim to generate optimized images.
But even before worrying about compression it’s important to resize images to an appropriate size for your WooCommerce store. Spend some time setting up some proper templates in your image editor of choice so that your product shots are sized appropriately for WooCommerce BEFORE you save them for the web. So rather than uploading a 2400px * 3000px shot of your product shots, create a template in your image editor that has your product sit nicely in a 1000px * 1000px canvas and this will make a massive difference to the file size of your images. In my case I DIDN’T do this with HeadSoundsDirect as we’re using the AliDropship plugin which imports poorly optimized product images from AliExpress.
Subscription based image optimization services
There’s been an explosion in the number of Subscription based image optimization services in the WordPress and WooCommerce ecosystem over the past few years and there are a ton of compelling options. With a subscription based service the heavy lifting image optimization tasks don’t happen on your server, they are executed on external, high performance servers tuned for image optimization tasks.
Pros
- Takes the pressure off of your precious server resources. This is a smart thing to delegate away from your own web server for nearly all WooCommerce websites..
- You don’t need to spend a lot of time configuring Image compression libraries on your server.
Cons
- Cost – you’re probably looking at a monthly recurring fee. Yet ANOTHER SaaS cost – argh!
Top picks for Subscription based Image Optimization
- Imagify – from the creators of WP Rocket. Really well executed product. Prices start at $4.99 per month for 1GB of data.
- Shortpixel Image Optimizer – This plugin has gone from strength to strength. If you spend any time ver on the WordPress Speed Up Facebook group, Shortpixel is consistently mentioned as being the best performing image optimization plugin. You get up to 150 images/month for free with no file size limit. Pricing then starts at $4.99/month for 7,500 per month. You should also keep an eye out for great Shortpixel deals on Appsumo which pop up every now and again. If you don’t like recurring billing you can purchase one-time plans which can help get you over the hump of a large batch processing job and then use their free tier on an ongoing basis. You can currently buy 15,000 images for a one off fee of $9.99 which is pretty good.
- Compress JPEG & PNG Images – A super plugin from the wonderful people behind everyones favourite Panda over at TinyPNG. You get approx. 100 images a month free. This is a great option to help speed up WooCommerce, particularly smaller WooCommerce stores. I often use TinyPNG when I need to quickly optimize one or two images so it’s great to have the option of baking in their great optimization service into WooCommerce.
Content Delivery Network (CDN) Based Image Optimization services for WordPress and WooCommerce
With a CDN based image optimization service, you’re not just delegating the image optimization process to an external service, that service is also responsible for the hosting and rendering of your images. For me, this is now the most compelling way to serve images in WooCommerce for a few really important reasons:
- Image optimization is pretty much a commodity service now. But serving adaptive images isn’t. This is a much trickier task that requires more sophisticated device/screen size detection and serving of different images depending on which file formats the browsing device supports AND figuring out what is the smallest possible image that can be sent to the device. Generating adaptive images on the fly is best on at a CDN origin that’s purpose built for that task.
- Images are usually are biggest bottleneck in website performance. CDN’s have a compelling value proposition to dramatically speed up image load times if they can service device optimized versions of images from locations closer to the end user.
- External Image CDN’s also usually incorporate additional awesome features like auto lazy loading of regular and background images, serving webp alternatives of images when device support is detected and so on.
Top picks for CDN based image optimization services
- Site accelerator from Jetpack (previously called Photon). This is my preferred Image CDN to help speed up WooCommerce right now. It’s 100% free with no restrictions on upload size/file type etc. There are 2 big disadvantages for Site accelerator:
- It’s part of Jetpack! Some people despise Jetpack at bloatware. I think that reputation is a bit unfair. But I definitely do not like that I can’t use Site accelerator without handing over all my website data to Automattic (which is exactly what happens when you install Jetpack). This immediately rules out Site accelerator for some WooCommerce websites I manage. But hey it’s 100% free because you’re the product so I’ll leave that up to you to decide if that’s something you’re comfortable with.
- Lack of control/configurability – you have zero options when it comes to deciding on image quality/compression settings/etc. In fact, you don’t even have the ability to purge an image from their CDN – so if you tweak and image you’ll need to change it’s file name in order to ensure the new image changes propogate out to Automattics servers – yuck!
- Shortpixel Adaptive Images (AI) – This plugin came out of beta in April 2019 so it’s a pretty new spin on Adaptive image optimization for WordPress and WooCommerce. This is a separate plugin from the main Shortpixel plugin but it operates on a similar pricing model (and you can use your main Shortpixel credits within Shortpixel AI. While it’s very new I really like it. Shortpixel AI works very similarly to Site Accelerator but with a few important differences:
- More control over optimization options – you can choose between lossless, lossy or glossy compression
- Switch Webp support on/off
- Smart cropping – this i really like – cropping algos try to determine the main subject in image
- Optimole – from the creators of CodeinWP.com comes another great WordPress Image CDN. Features are similar to both Shortpixel AI and Site accelerator. Optimole is a freeium product meaning you get 1GB of images free per month and EUR9.99/month for 10GB images/month after that.
Despite very deal drawbacks Site accelerator is still my preferred Image Optimization method for speeding up WooCommerce. Automattic’s servers are incredibly fast, reliable and have huge global reach. But both Shortpixel AI and Optimole offer great alternatives if you’d want to use Jetpack. I really feel that Image CDN’s are going to be the most popular way we serve images on WooCommerce websites in the future.
Let’s try a few of our Image CDN options out on HeadSoundsDirect!
Optimole on HeadSoundsDirect
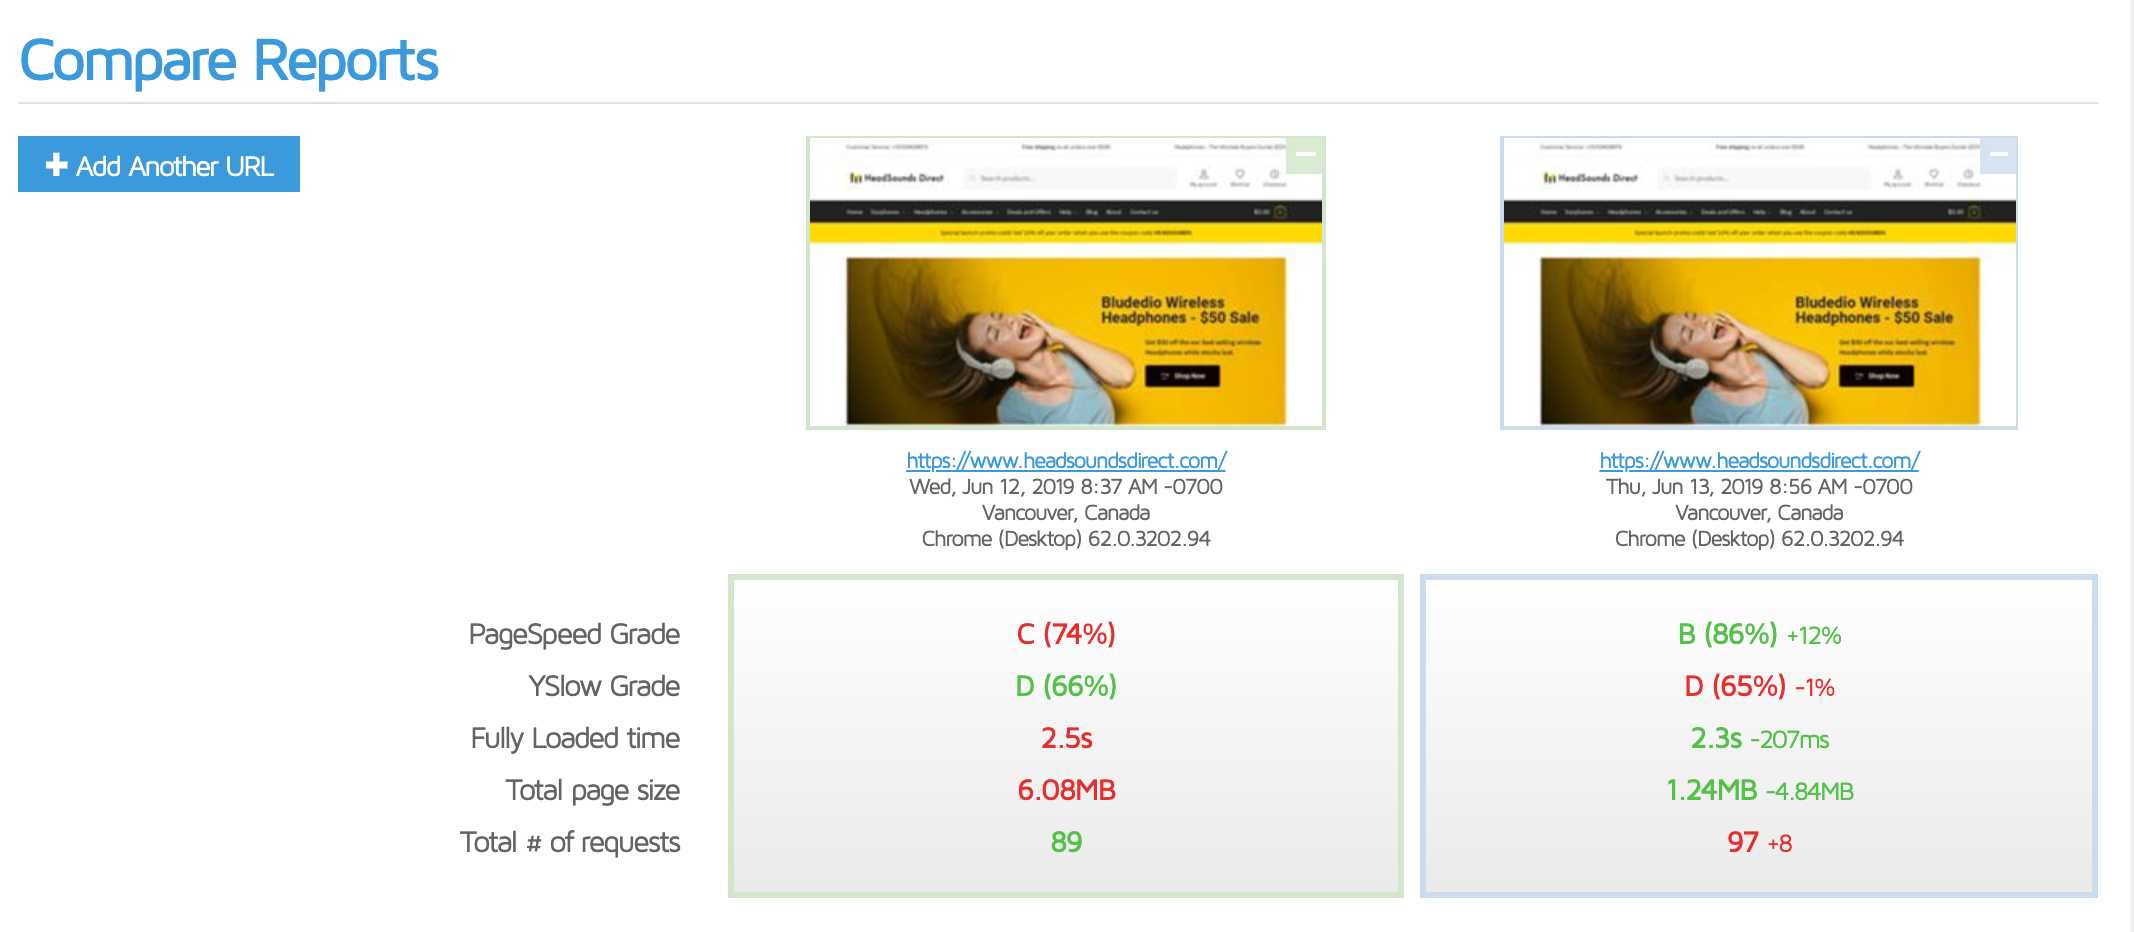
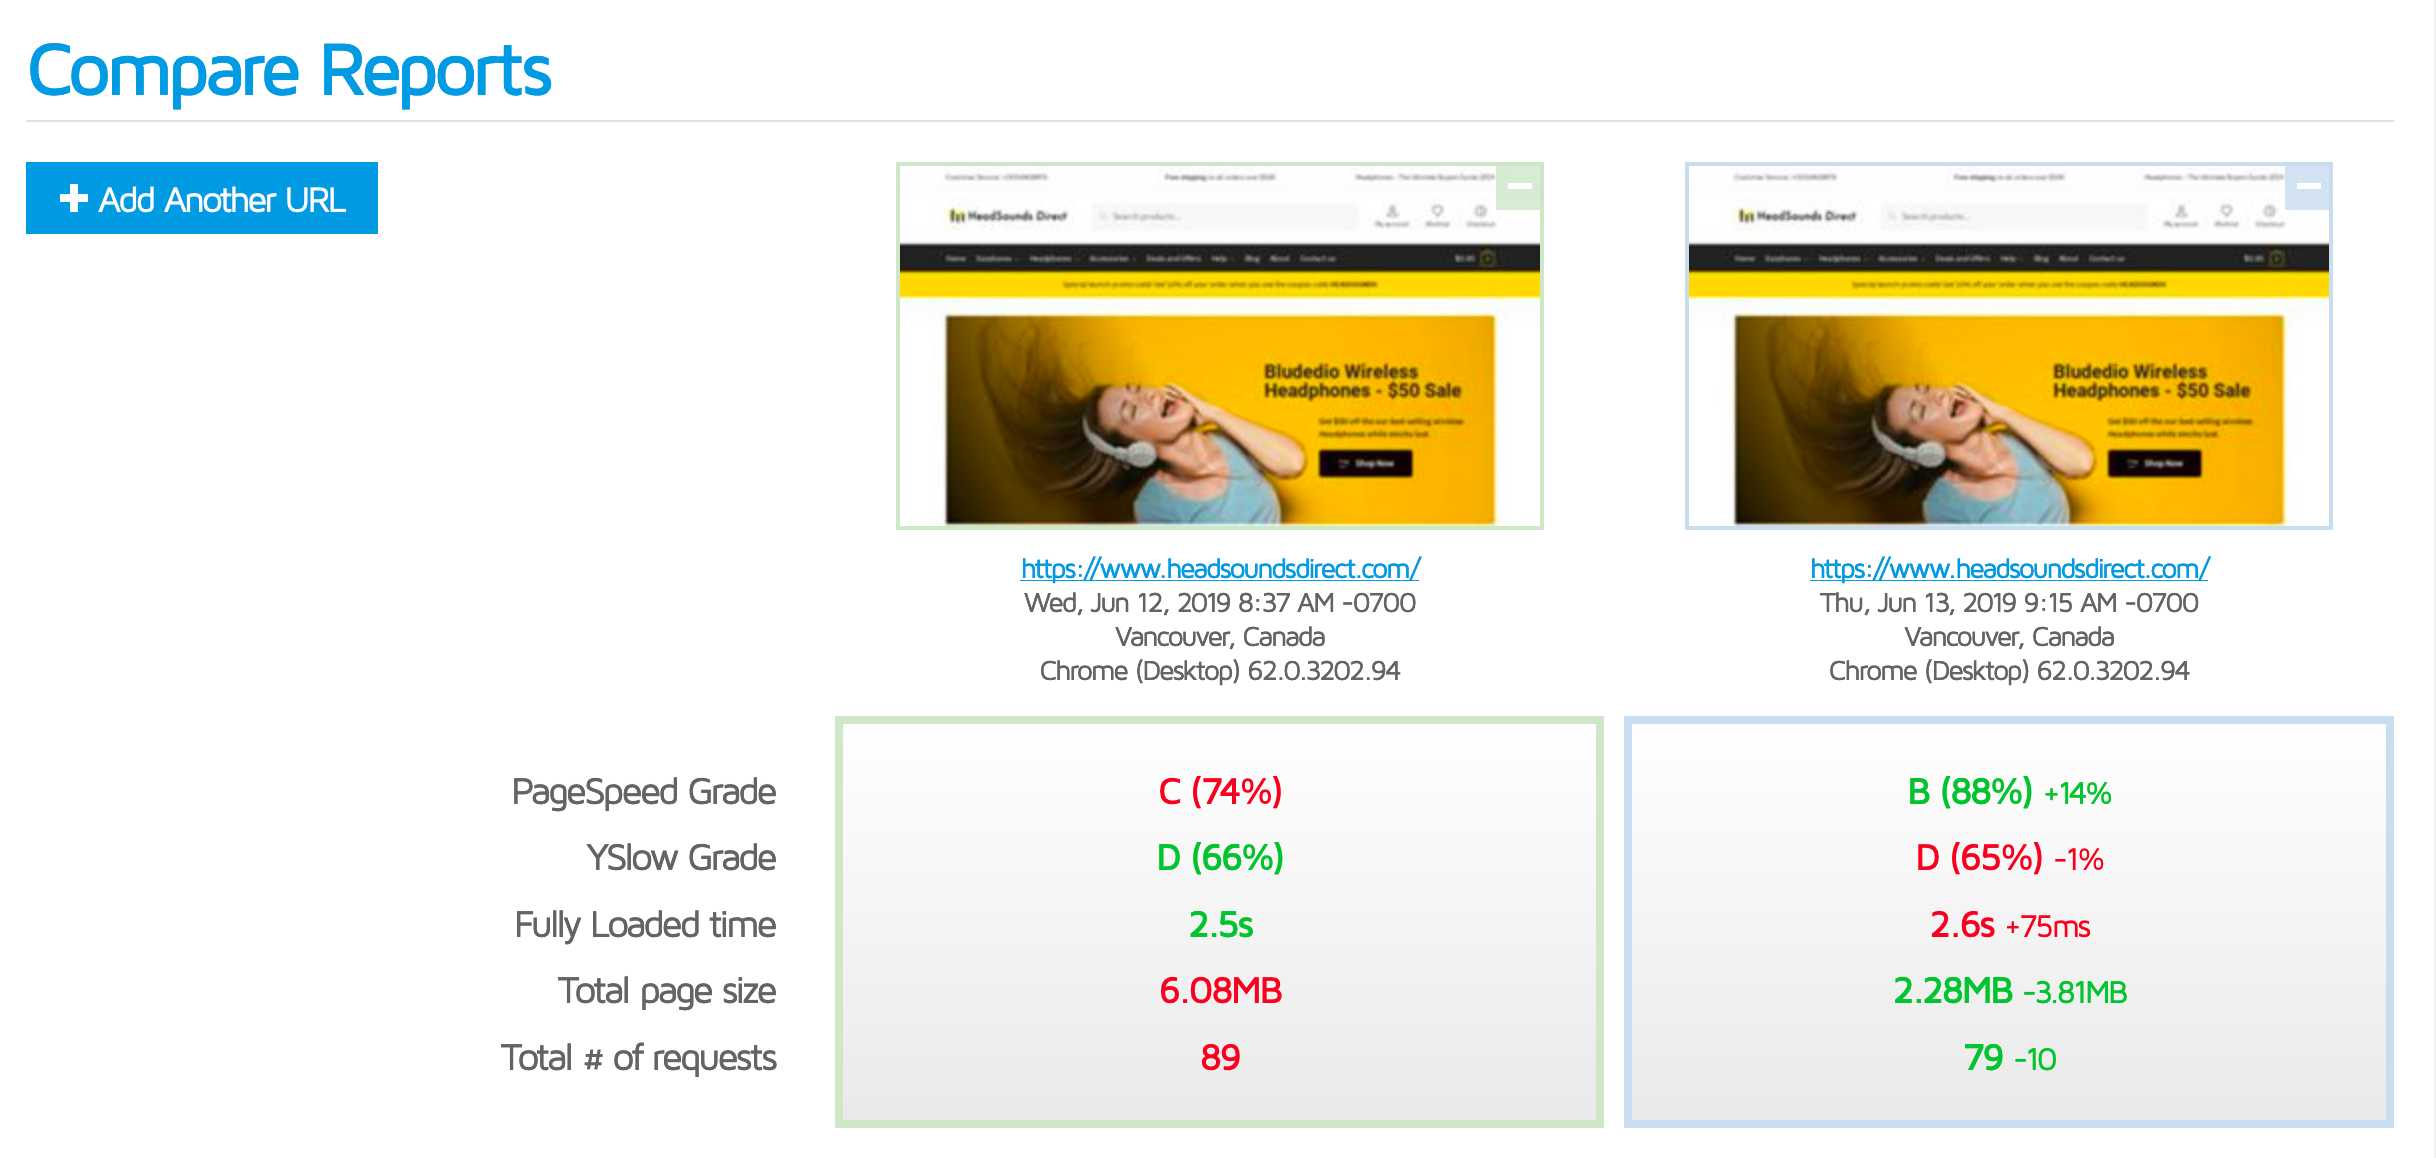
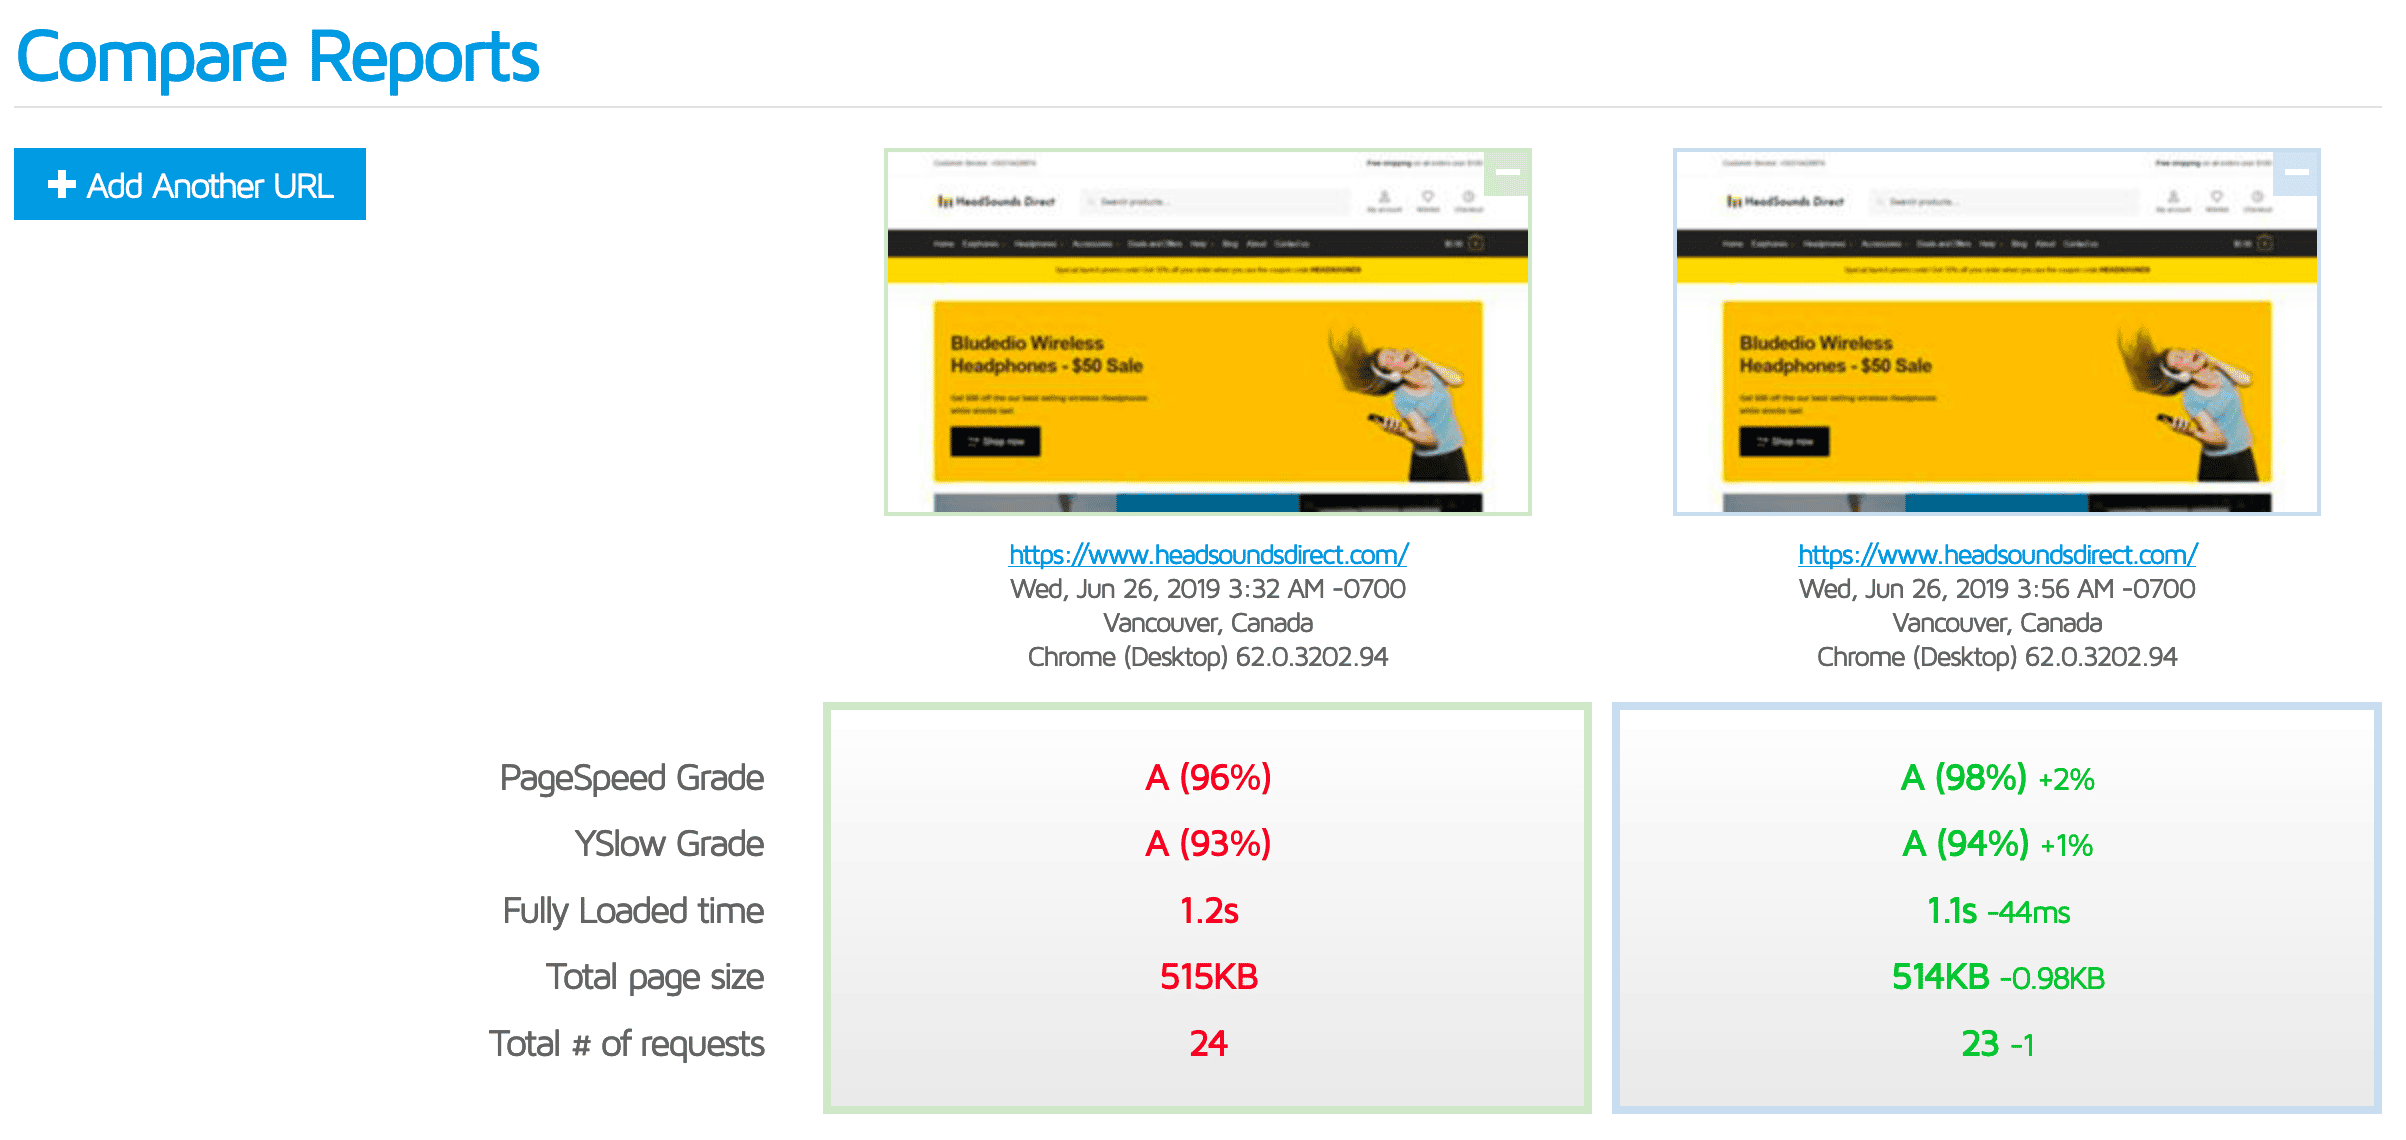
After installing and configuring Optimole on HeadSoundsDirect and re-running GTMX, we can see it has an immediate impact on some key metrics.
- Total page size is down by 4.84MB. That’s a massive improvement!
- Fully loaded time down by 207ms
- Interesting our total # number of requests went up from 89 to 97 which I’m not a big fan of. Looking closely at the Optimole waterfall chart reveals that Optimole actually generates 2 images of some images by default. (my guess is that Optimole is only doing this for images above the fold). The first is a tiny blurred out placeholder image while the second is the main optimized version of the image. I’d love to know about why the took this approach as I’m sure a generic placeholder and/or a simple SVG placeholder would work just as well and keep the number of requests down.
View full GTMX Comparison report
Our GPSI Scores improved a bit too:
- Mobile: 37 (+7 points)
- Desktop: 68 (+17 points)
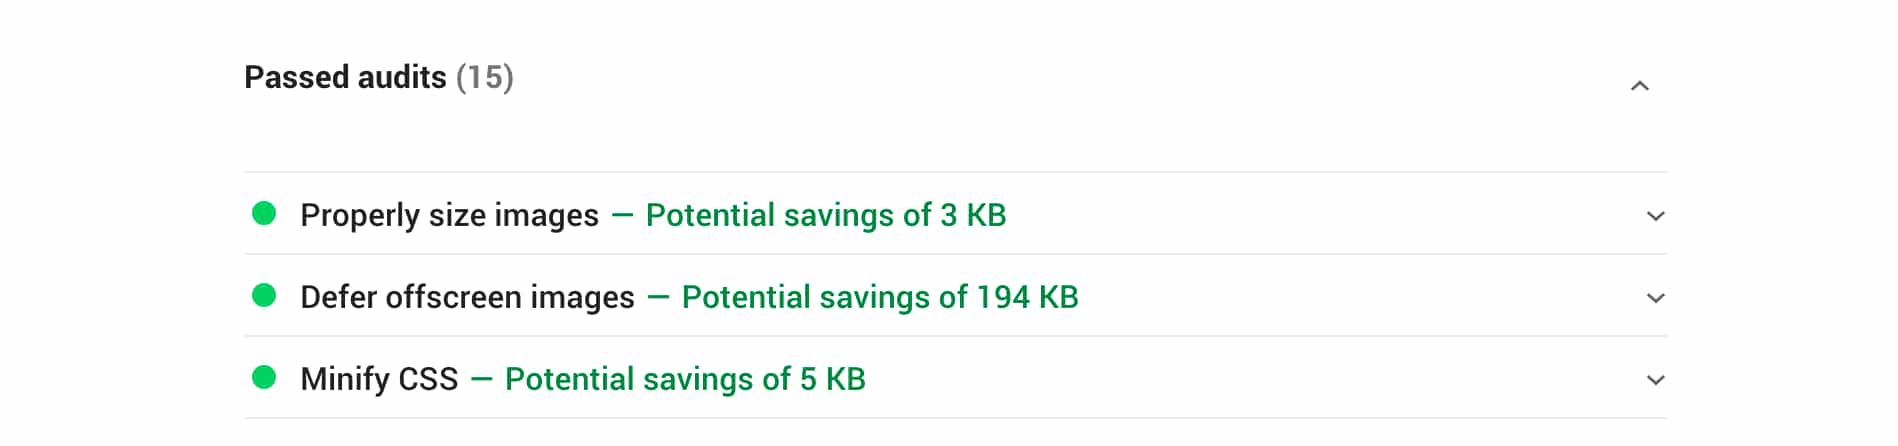
And we pass the relevant GPSI image audit tests too.
Not being 100% comfortable with the increase in http requests, let’s take a look at what Site accelerator can do.
Jetpack Site accelerator on HeadSoundsDirect
Once you’ve enabled Jetpack, you’ll want to configure the Performance settings as follows:
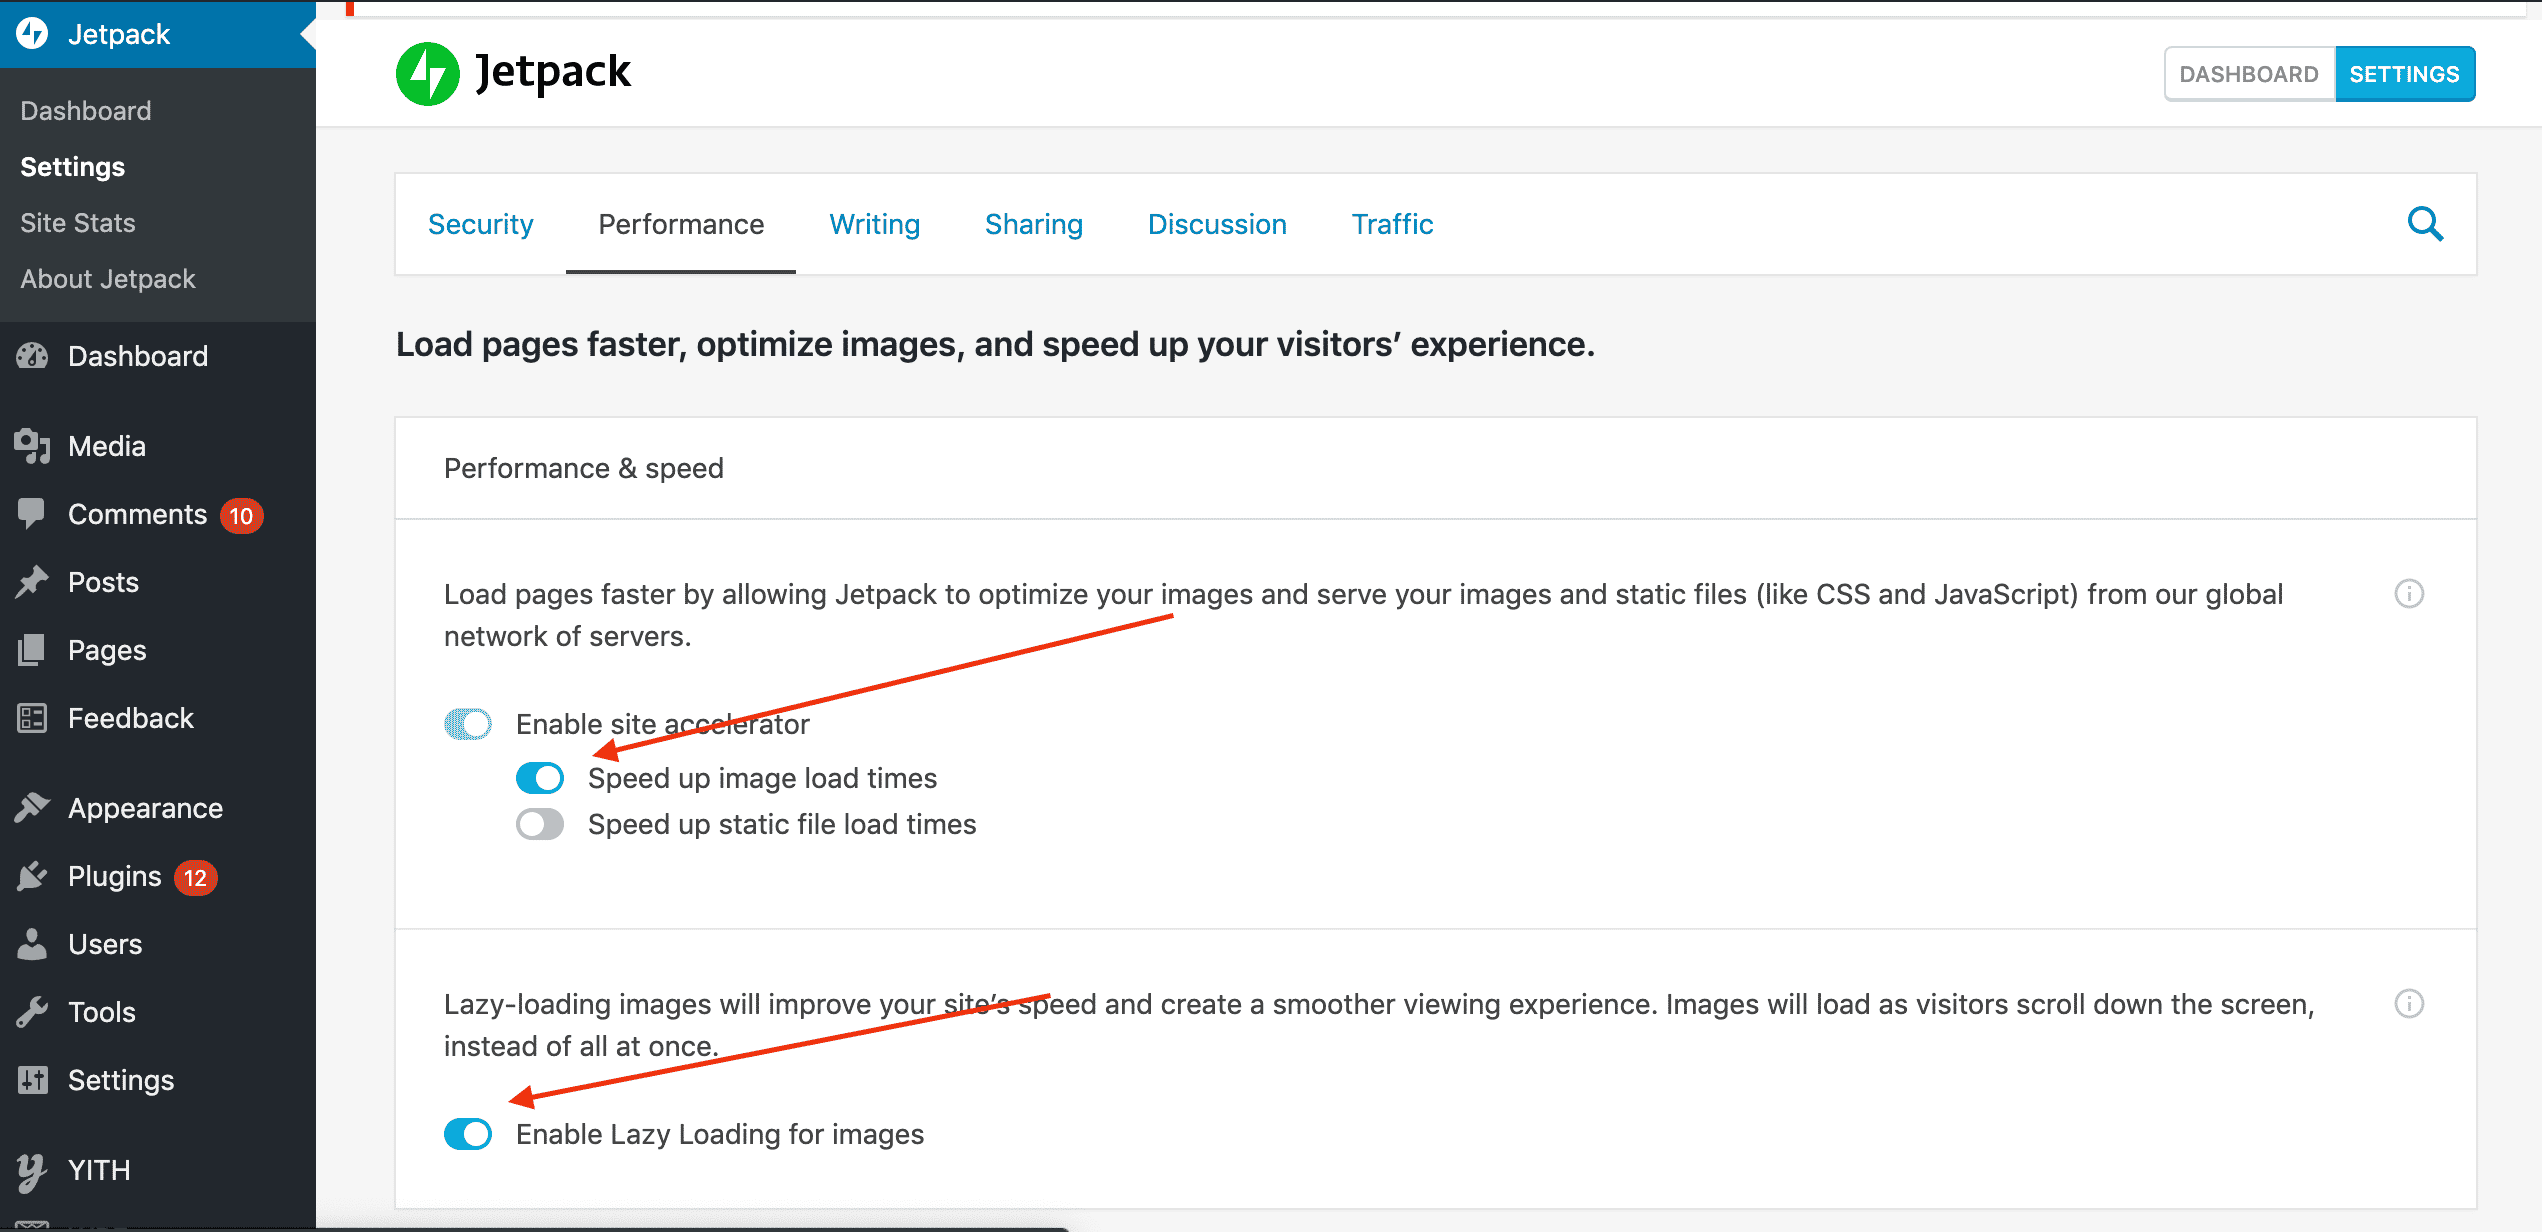
Let’s then fire up GTMX and compare with our baseline report.
- Total page size is down by 3.81MB – not quite as good as Optimole but still pretty good!
- Total # of requests is down 10 which is what I was hoping for.
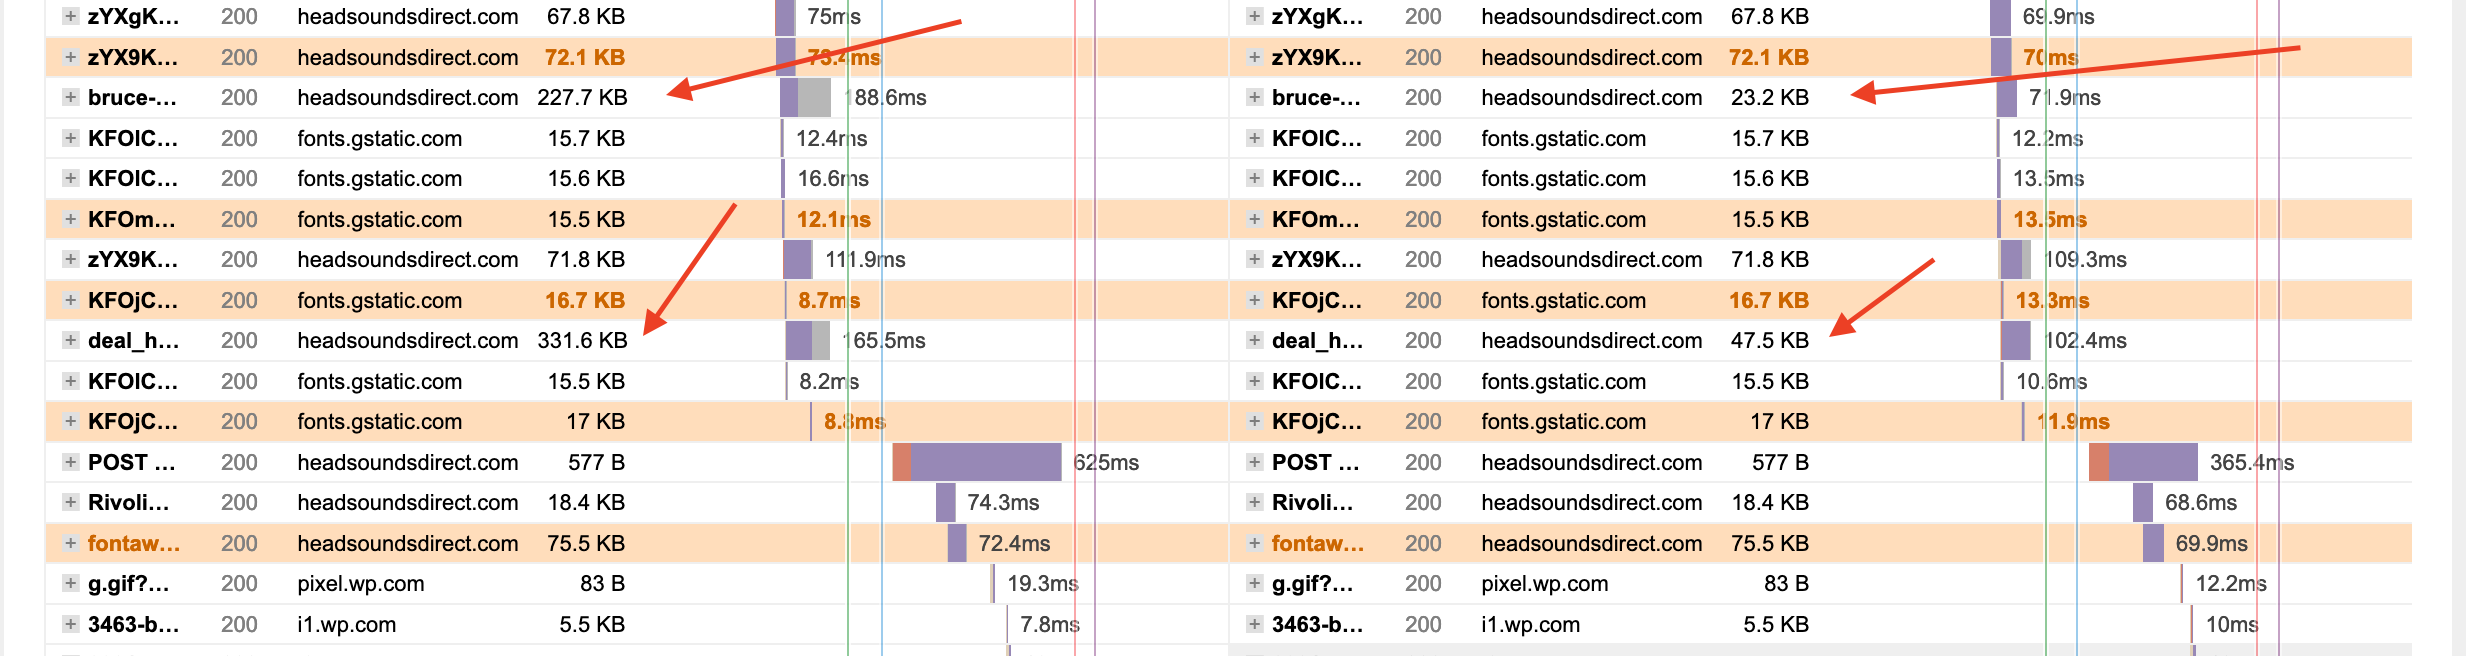
Upon closer inspection I was able to see why Optimole did a better job reducing our image payload – and it’s all down to 2 pesky images.
Optimole worked it’s magic on these 2 images but Jetpack didn’t – what gives? Those 2 images are actually background images which originate in Elementor CSS. Jetpack misses these unfortunately, but Optimole has full support for Elementor and actually replaces the image path in the relevant CSS – nice!
Our GPSI Scores with Jetpack:
- Mobile: 47 (+17 points)
- Desktop: 76 (+26 points)
So Jetpack does a better job at improving our GPSI scores despite missing 2 of our largest images – which in of itself tells you a lot about GPSI. GPSI it seems really doesn’t like the additional http requests that Optimole generates.
But we can have our cake and eat it. I decided to take the extra GPSI points that Jetpack is giving us and simply manually optimize the 2 images Jetpack missed by manually running them through TinyPNG.
Things are looking MUCH better with Jetpack now.
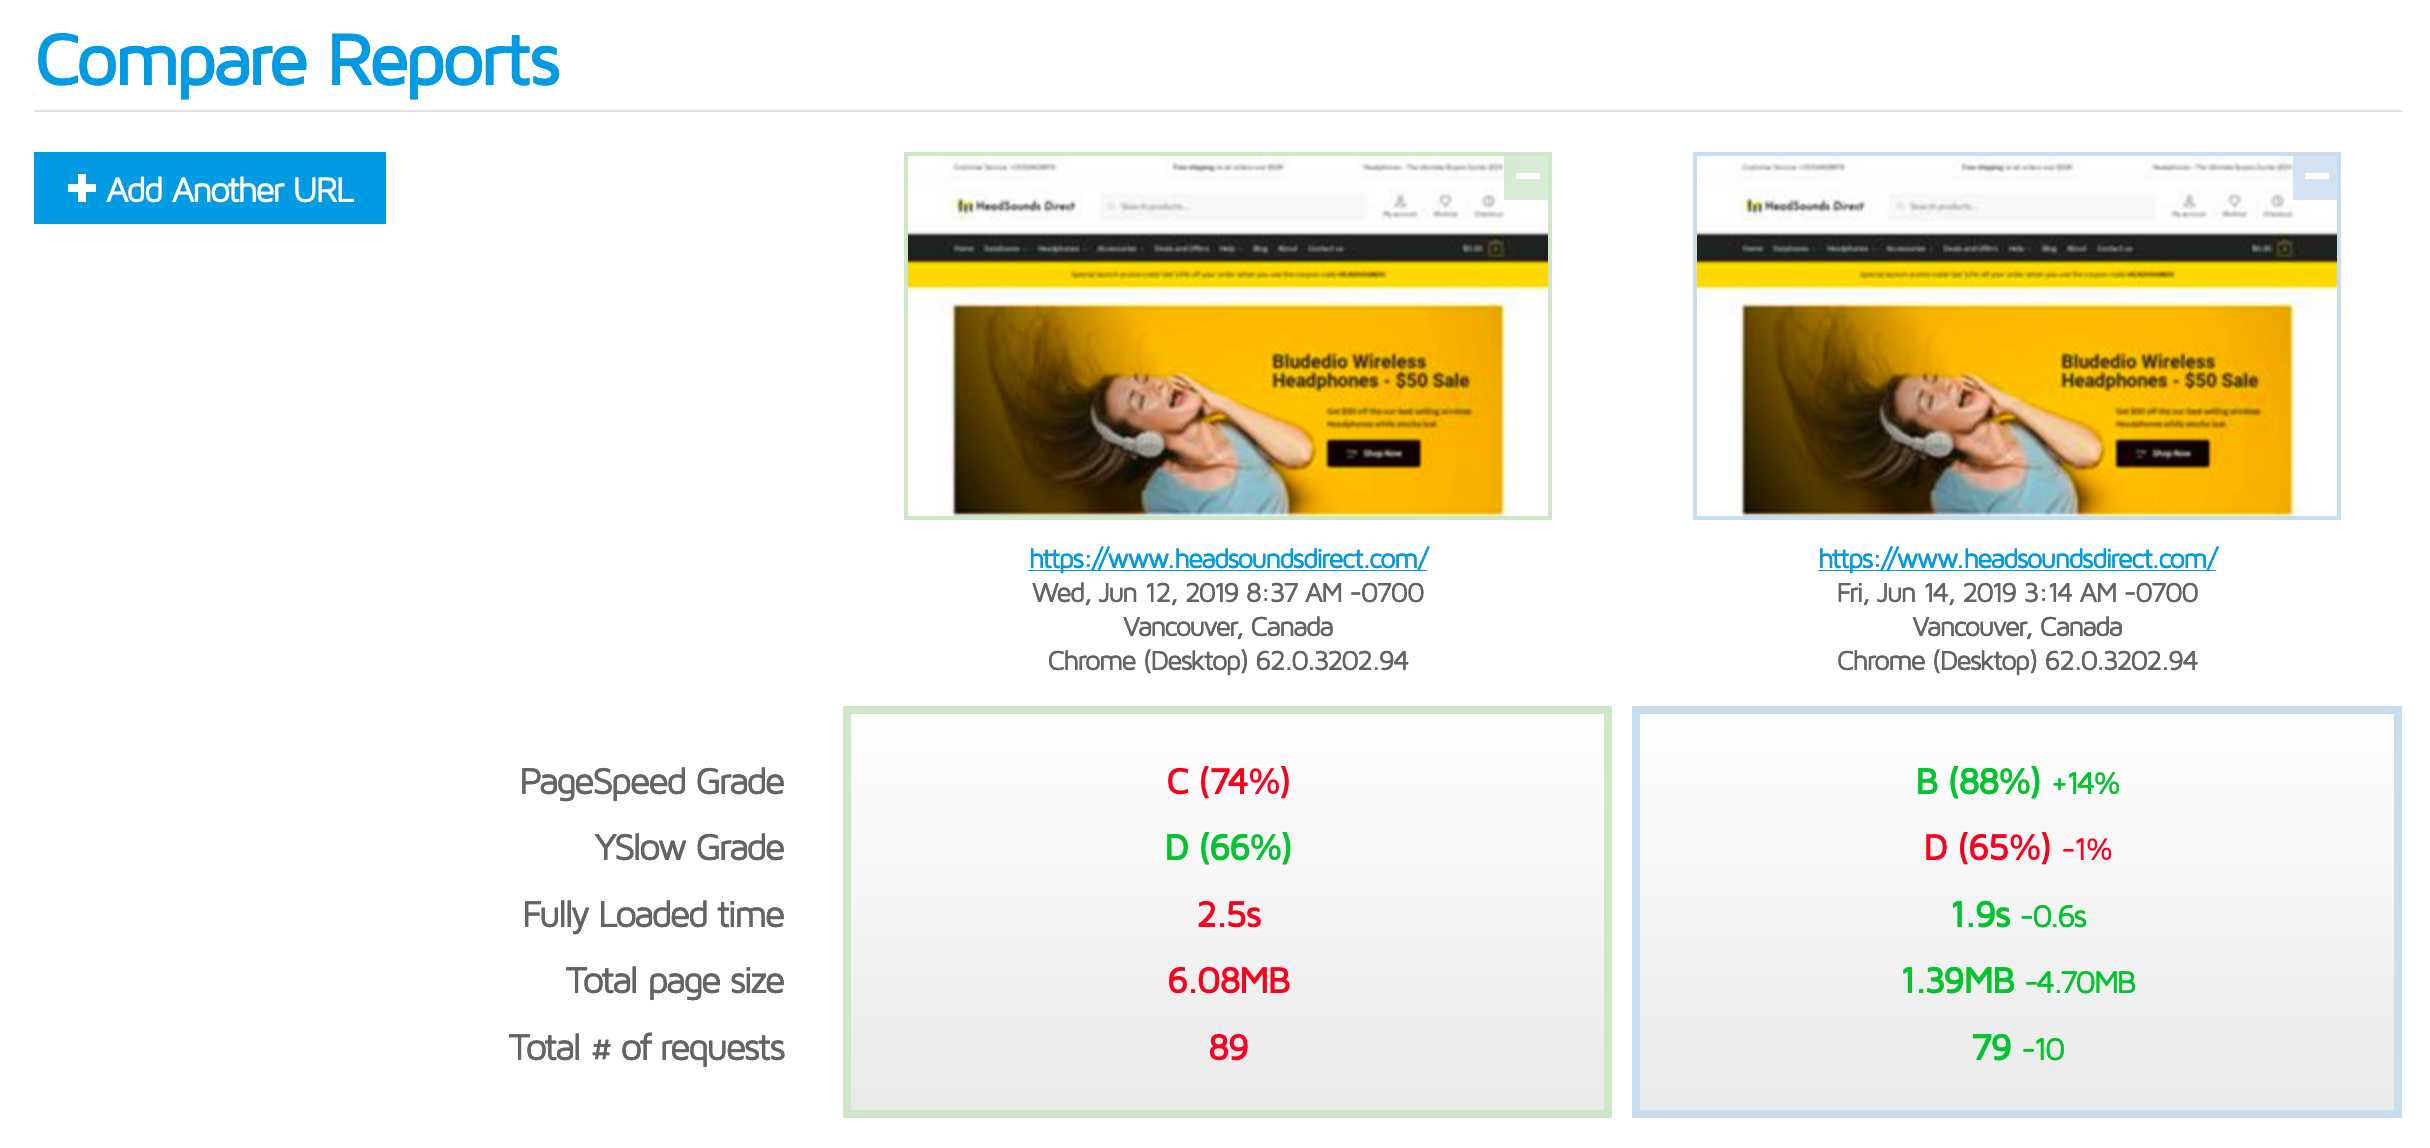
- Total page size is down by 4.7MB – which is pretty close to Optimole. This tells me that Jetpack and Optimole have quite similar default optimization compression settings. (with Optimole being slightly more aggressive).
So we get to keep our better GPSI scores AND get the Total page size down to a respectable number 🙂
That’s the low hanging fruit of Image Optimization taken care of, now on to the next major task.
Concatenate and minify CSS/JS files
As you’ve just seen there so many compelling Image optimization options to choose from. Thankfully, concatenating and minifying CSS and JS assets is a much simpler task with one clear method of doing this that I’ve trusted for years and that’s the Autoptimize plugin (AO) by Frank Goossens. Autoptimize is easily one of my favourite WordPress plugins of all time. It has taken what can often be a complex and painful process and simplified it dramatically, but also allowing for a lot of configurability when you need it.
My Autoptimize configuration process is pretty straightforward. I captured it in one of our speed up WooCommerce video tutorials which you can view below (relevant Autoptimize bit starts at 34:28)

NOTE: One of the big time saving features of our Shoptimizer WooCommerce Theme is that you don’t need to spend a lot of time and heartache figuring out what the critical css for your website should be. Shoptimizer comes with prebuilt critical css for all major page templates! You’ll see in our AO config that we assume you’re using Shoptimizer. If you’re not using Shoptimizer you’ll need to build your own critical css for your website. Smashing has a great introductory article about Critical CSS.
Let’s take a look and see what impact AO has had on HeadSoundsDirect.

View full GTMX Comparison report
- Total # of requests is down by a further whopping 37 requests (on top of the 10 we already shaved off with Jetpack).
- Fully Loaded time is down another 257ms.
- Total page size has barely changed which isn’t that surprising considering many of the plugins we’re using we’re already serving minified CSS/JS.
Our GPSI Scores with Autoptimize:
- Mobile: 71 (+24 points)
- Desktop: 95 (+19 points)
Woah that’s a big jump! Remember our page size and fully loaded time are relatively unchanged, but yet, combining and minifying our CSS/JS assets has had a massive impact on our GPSI scores. Yet more evidence as to how important it is to minify http requests even in a post http/2 world. The increase in GPSI is also explained by the fact that AO has now made most of our CSS non blocking to the page render process. This is an example where I think it’s prudent to pay more attention to GPSI mobile scores rather than GTMX fully loaded times. Blocking CSS can dramatically slow down render times on low powered mobile devices running on slow internet connections. You typically wouldn’t notice this in a GTMX test run.
We’re making solid progress now but there’s definitely more we can do – on to our next action!
WebP support for images missed by Jetpack
Jetpack’s Site accelerator will actually serve images using Google’s proprietary WebP file format if it detects that the users browser has WebP support. WebP files are typically up to 25-40% smaller than the equivalent PNG file so it’s a big deal! With Firefox having recently rolled out WebP support with Firefox 65 we’re going to see a lot more WebP usage in 2019 and beyond.
If you remember earlier we had a couple of images that weren’t being picked up by Jetpack. We can still serve those as WebP files using the wonderful WebP Express plugin. I went ahead and installed and activated WebP Express and ran GTMX.
The results speak for themselves.

- Total page size dropped a whopping 490kb thanks to massive file size savings in those 2 images Jetpack missed.
Our GPSI Scores with WebP Express:
- Mobile: 74 (+3 points)
- Desktop: 95 (unchanged)
So we’ve squeezed out a few more mobile percentage points – cool – onwards!
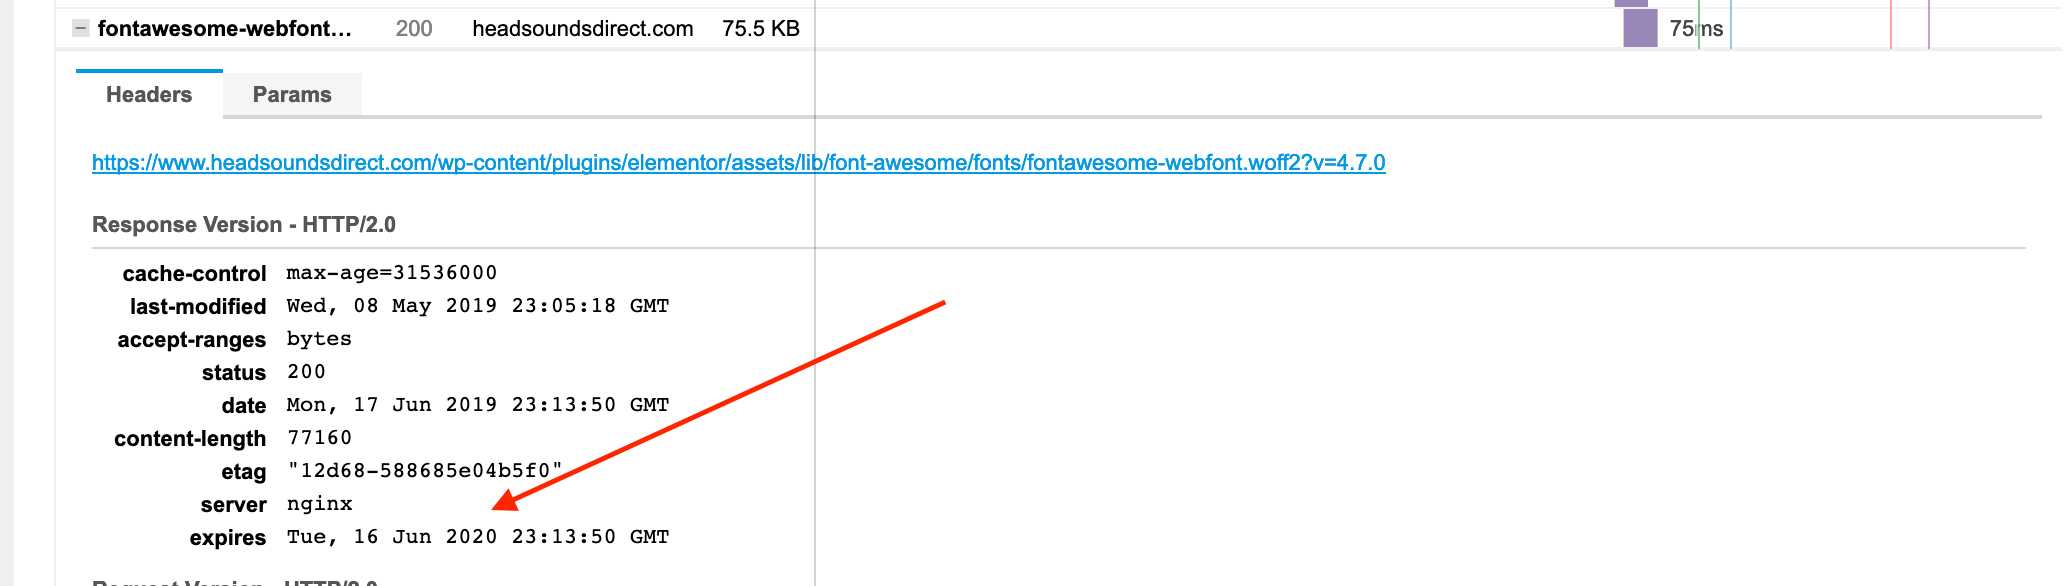
Leverage browser caching
Before we deal with font files (which was the next action on our list) I noticed that another obvious optimization I assumed would in place in Cloudways by default wasn’t actually in place – Leveraging Browser Caching.
In short, it’s important we set http headers to tell our browsers how long they should cache http request for assets like CSS/JS and image files. By not setting these headers, or not setting them for a sufficiently long period of time will trigger lower GPSI scores and lower grades in GTMX and WPT.
That’s definitely some low hanging fruit we missed – let’s fix that!
Adding expires headers in Apache
Cloudways runs good ‘ol Apache behind our Varnish caching layer so we can easily set expires using our .htaccess file.
# START EXPIRES CACHING #
ExpiresActive On
ExpiresByType text/css "access 1 year"
ExpiresByType text/html "access 1 year"
ExpiresByType image/gif "access 1 year"
ExpiresByType image/png "access 1 year"
ExpiresByType image/jpg "access 1 year"
ExpiresByType image/jpeg "access 1 year"
ExpiresByType image/x-icon "access 1 year"
ExpiresByType application/pdf "access 1 year"
ExpiresByType application/javascript "access 1 year"
ExpiresByType text/x-javascript "access 1 year"
ExpiresByType application/x-shockwave-flash "access 1 year"
ExpiresDefault "access 1 year"
# END EXPIRES CACHING #
After experimenting with different expiry durations I’ve found that GPSI only gives you full credit for this once you’ve set expiry at a minimum of 1 year.
Adding expires headers with nginx
If you use nginx you’ll need to modify your main vhost config to include something like this.
    location ~*  \.(jpg|jpeg|gif|png|svg|pdf|css|html|js|swf)$ {
        expires 365d;
    }
You can verify your new http headers are being set correctly by inspecting a http request headers in your waterfall chart. Note the expiry date is 1 year from the initial request time.
Let’s jump back into GTMX and see how we’re doing.
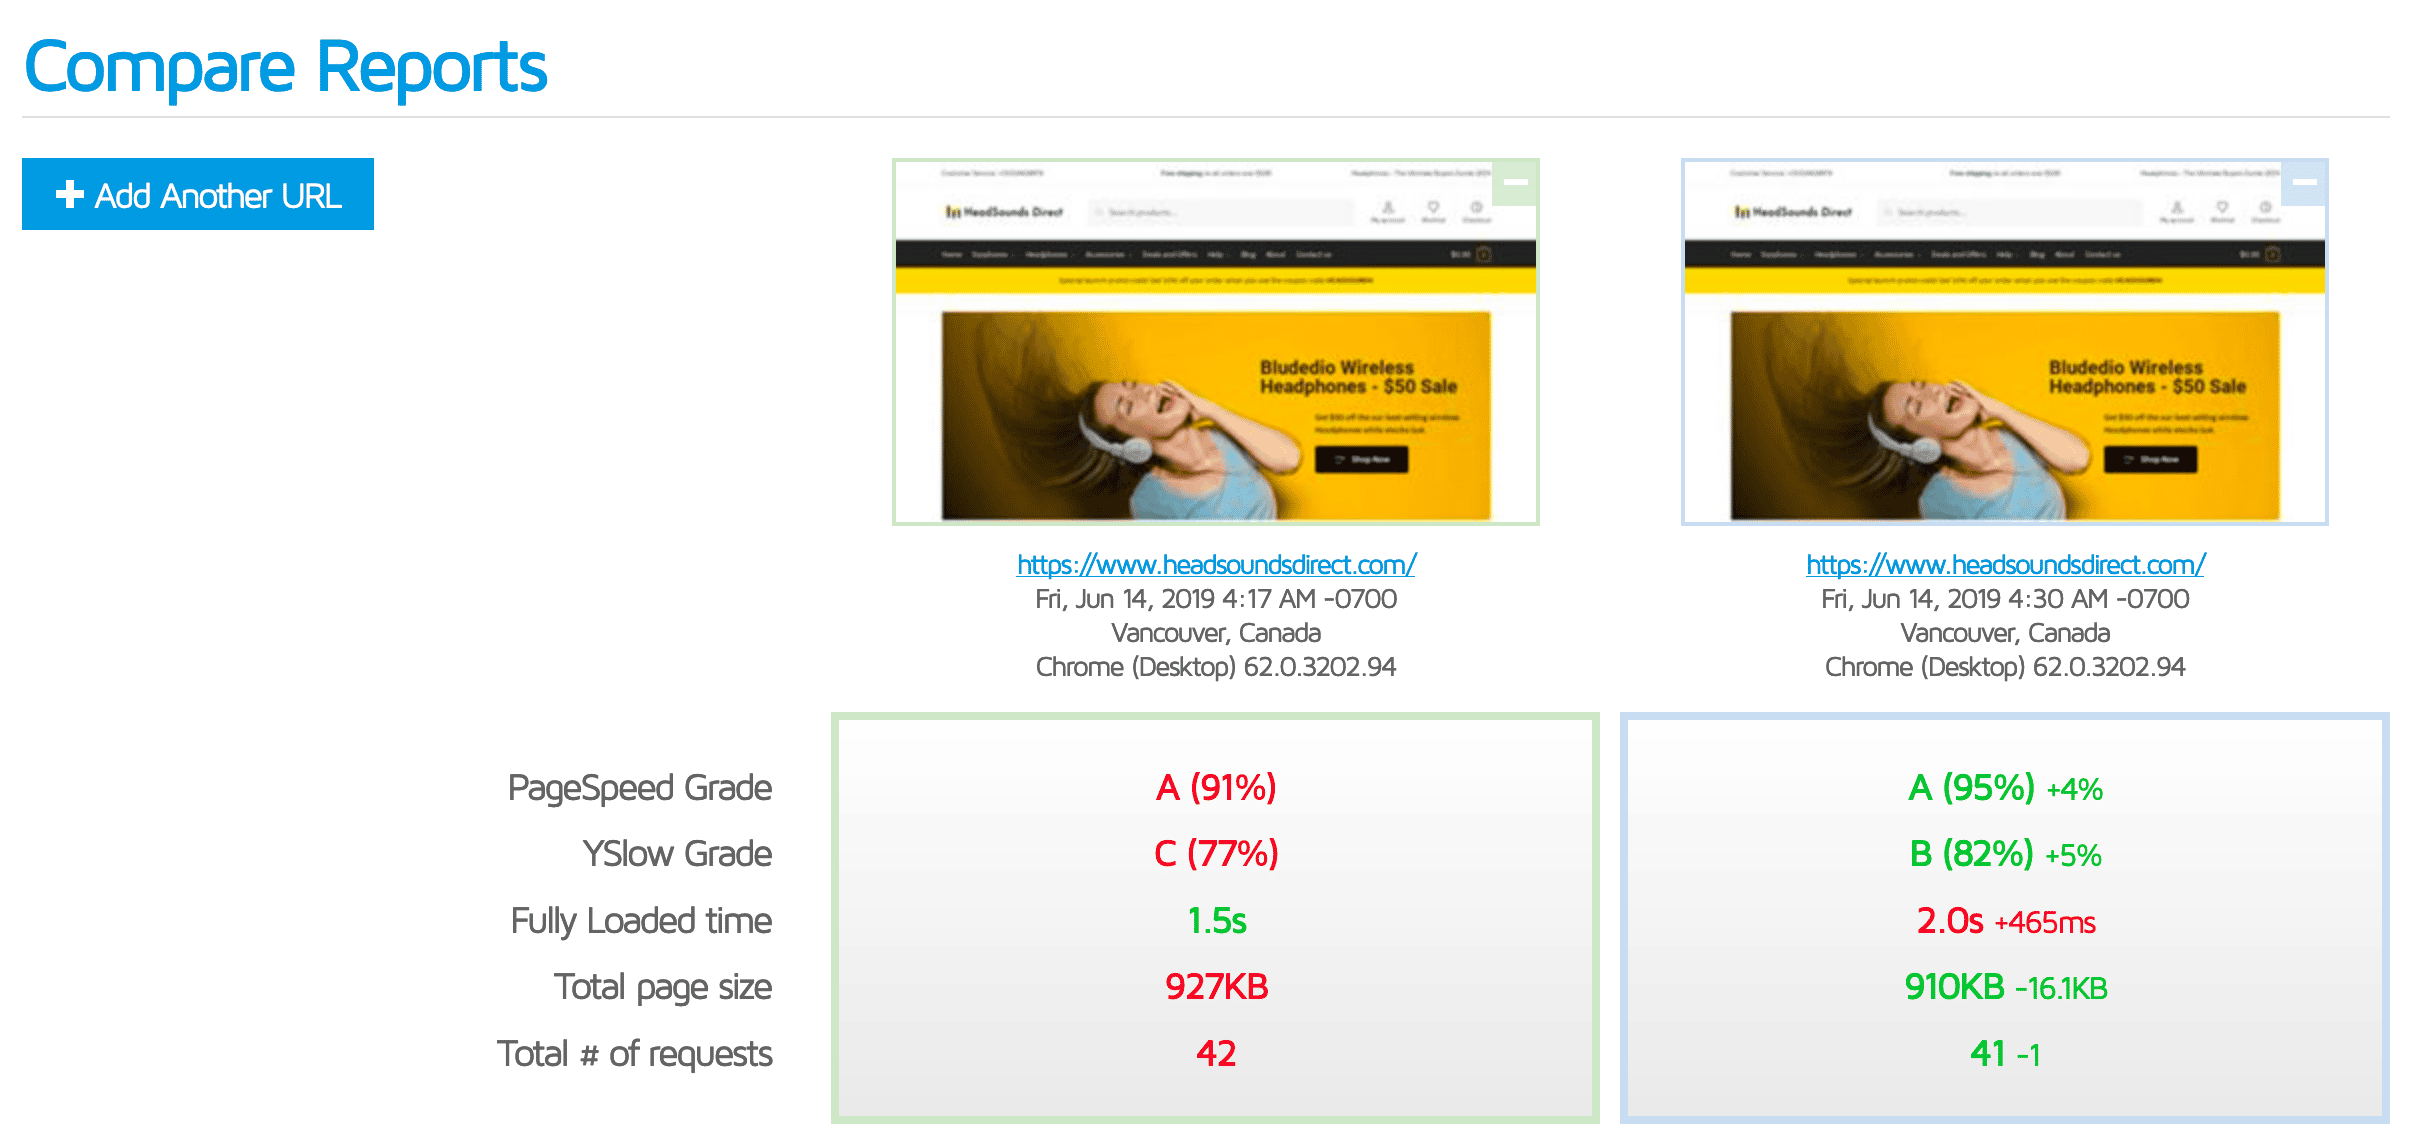
- The first thing you’ll notice is that our Fully Loaded Time has increased by 465ms. I’m not too concerned about this right now as it looks like GTMX was quite congested when I was running this batch of tests. It’s worth reiterating that you will see variances in your testing tools from time to time. Let’s just keep an eye on it in our next batch of tests.
- You’ll see our GTMX PageSpeed grade has jumped 4% reflecting the fact that we’re now setting expires on most of our http headers.
Our GPSI Scores with after fixing Leverage Browser Caching:
- Mobile: 78 (+4 points)
- Desktop: 95 (unchanged)
So our mobile scores continue to creep in the right direction – let’s keep going!
Remove font files
So right now we have 10 font files in our waterfall. Shoptimizer by default uses the IBM Plex Sans Google font which is a really nice font. But we’re on a mission to get our GPSI scores as high as possible and I know Google fonts and web fonts in general have a big impact on speed – particularly mobile speed. So to help speed up WooCommerce, let’s ditch ’em for now – frankly they’re not worth the hassle for me. Besides, System font support has come a long way since the days of Times New Roman, Arial and Verdana 🙂
To switch to system fonts I needed to go through all the Typography settings in the Customizer and switch them to use the default Browser Font-Family.
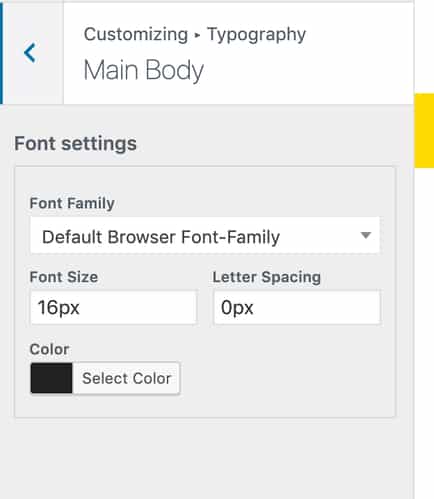
We’ve quite a few Typography settings in Shoptimizer so this might take a minute or two for you to find them all. Once you’re done re-run your GTMX tests.
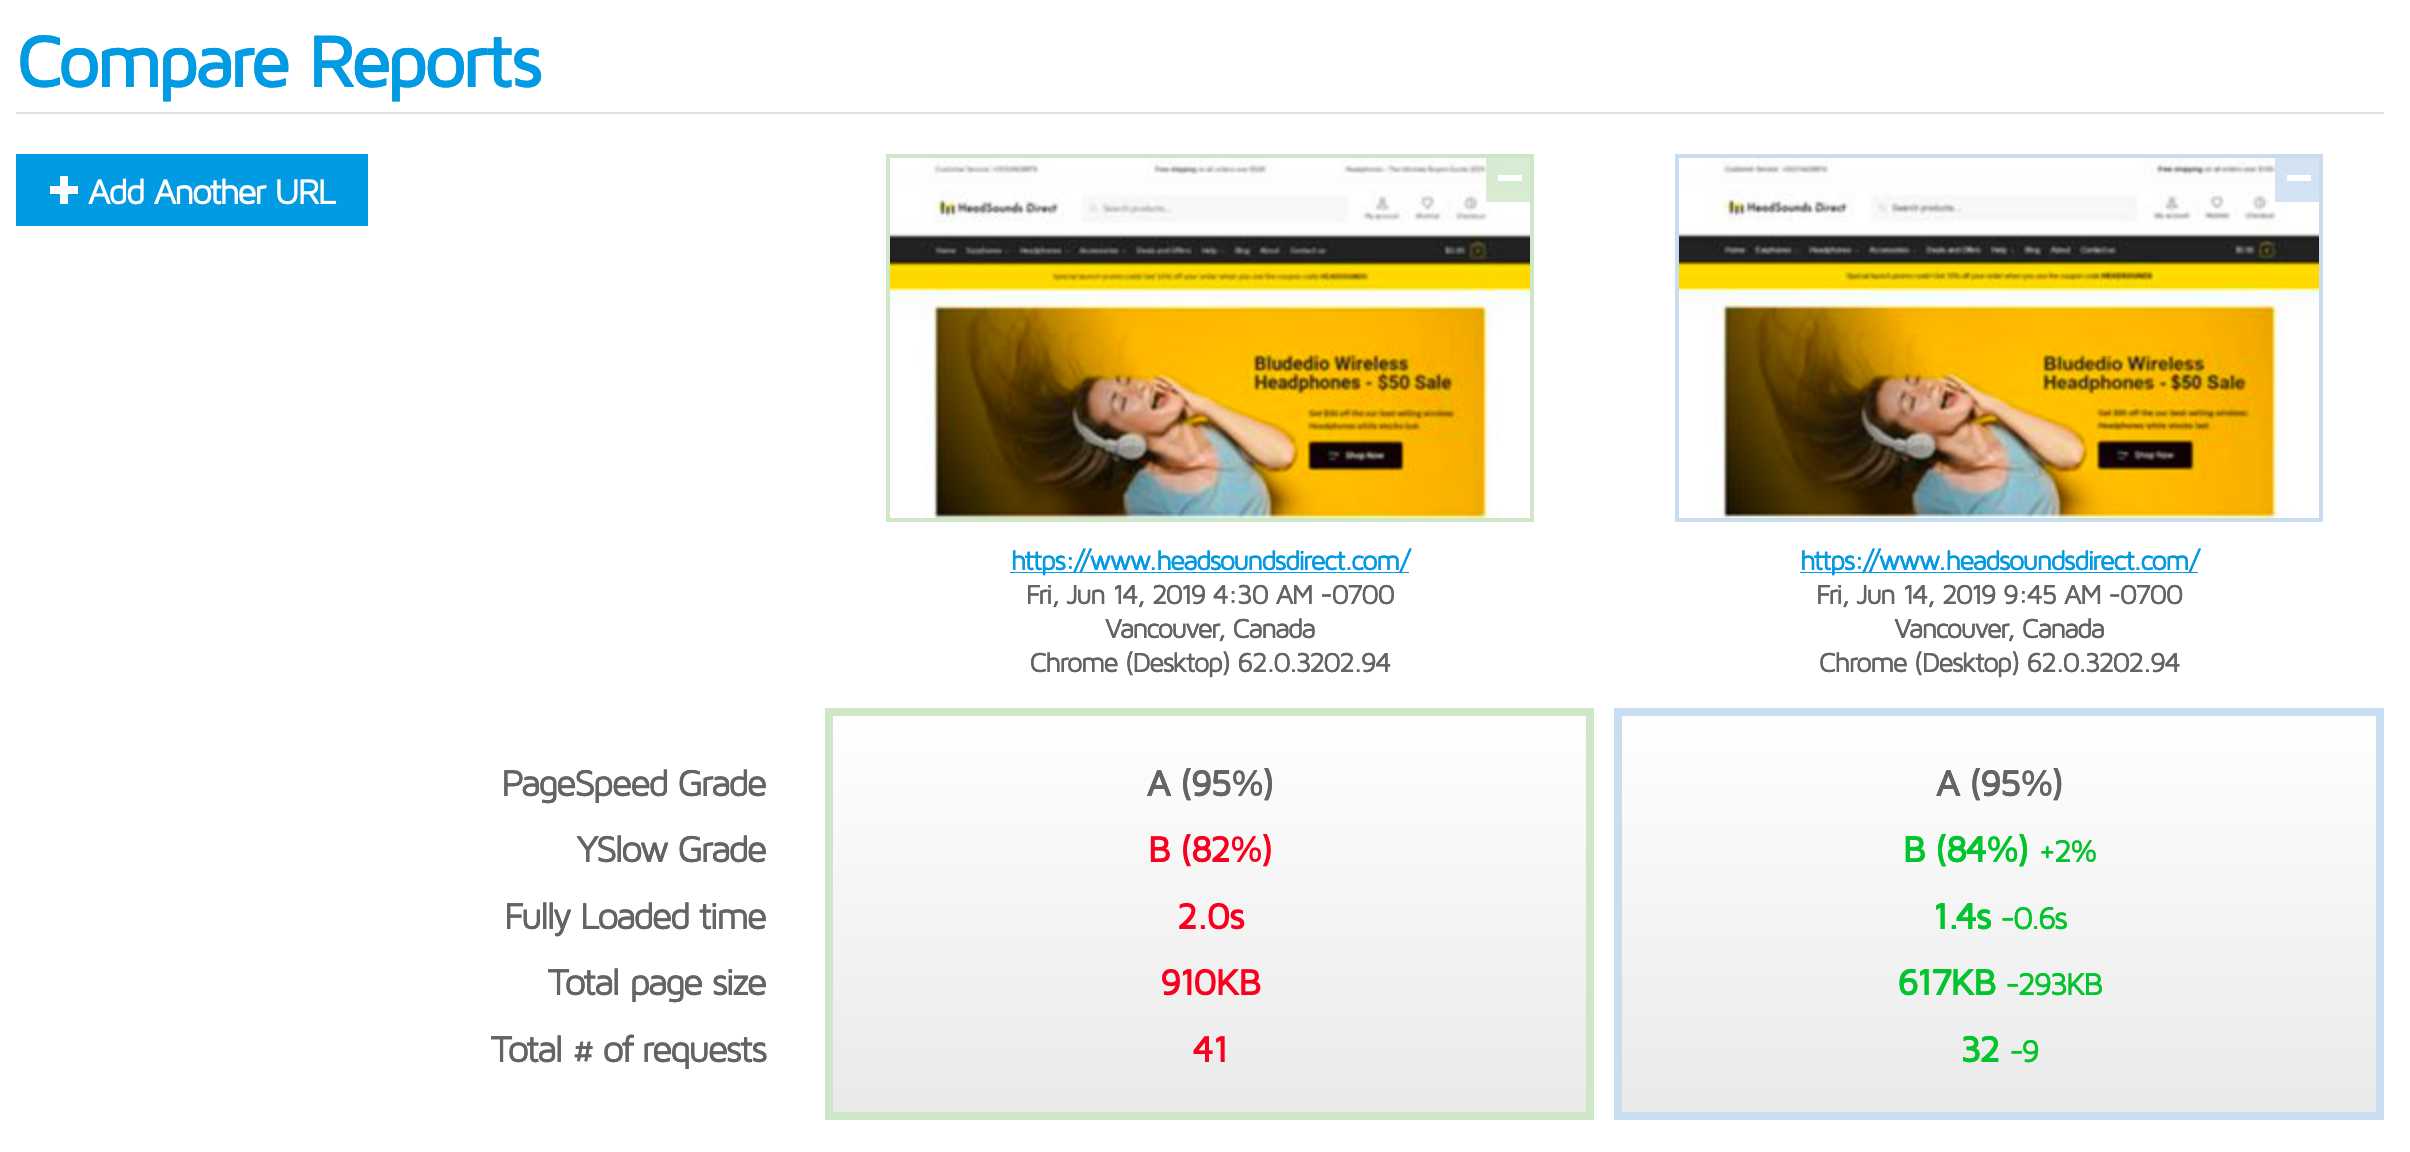
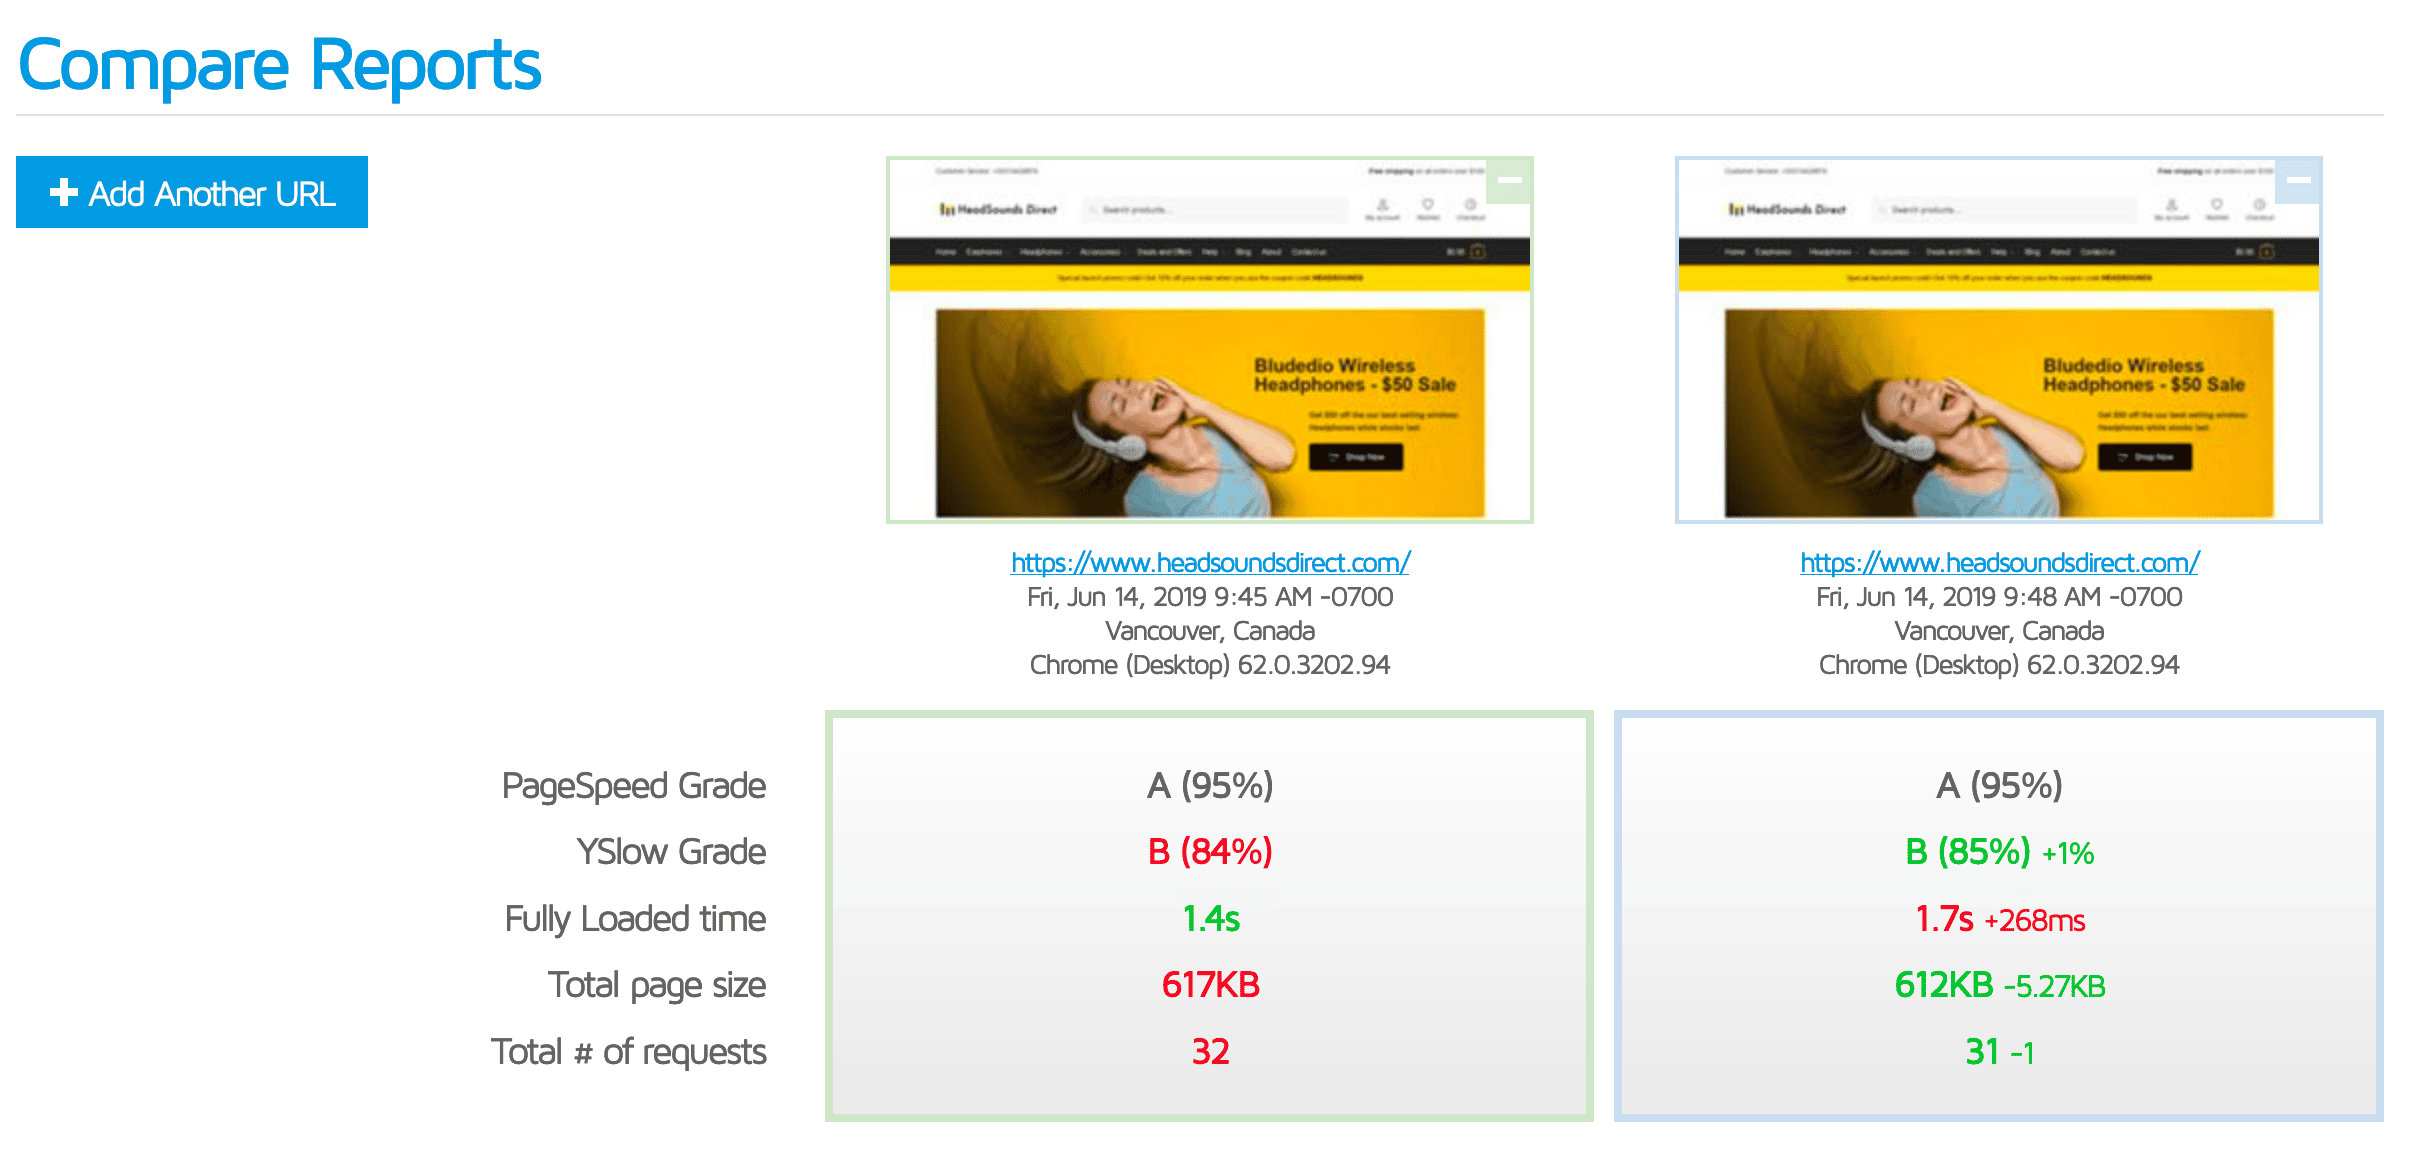
- Our Fully Loaded time is back to normal 🙂
- We’ve knocked 293kb off our page size meaning our homepage total page size is now down from over 6MB to a very respectable 617kb!
- We’ve knocked 9 requests off thanks to the removal of all those font files.
So solid improvements on fundamentals, but what about GPSI?
- Mobile: 82 (+4 points)
- Desktop: 97 (+2 points)
That’s a solid bump on both platforms!
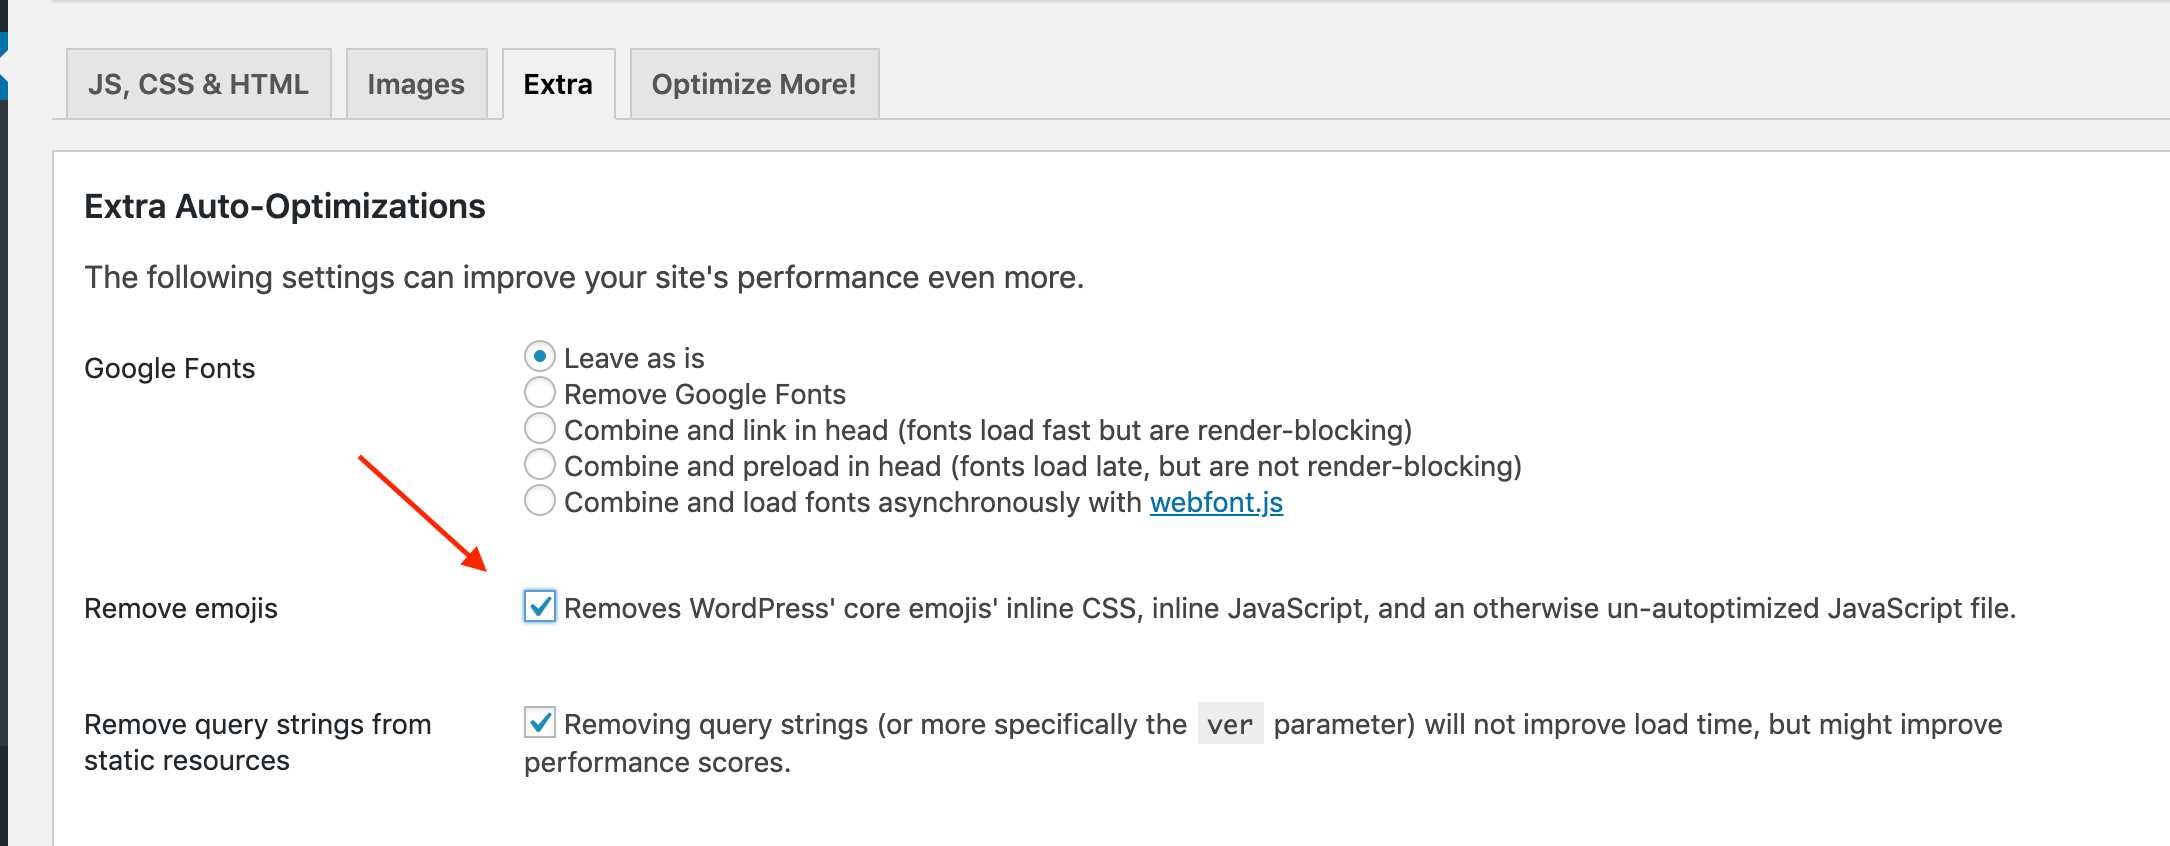
Remove WP Emoji
We can remove one additional js file and save an additional 5kb by removing the WP Emoji. If you’re partial to your emojis you may want to skip this one but on an eCommerce website they’re non-critical. As we’re now moving beyond the low hanging fruit we’re going to be ruthless about where can squeeze out some additional performance improvements 🙂 There’s a few ways to do this but AO has you covered with an option in its Extra settings.
Fire up GTMX and let’s see if that’s helped.
- Our Total # of requests is down by 1 to 31 which we expected.
- Our Total page size is also down another 5kb as expected.
Our GPSI Scores with after removing WP Emoji:
- Mobile: 84 (+2 points)
- Desktop: 97 (unchanged)
Just like Al Pacino said in Any Given Sunday – it’s a game of inches with Google Pagespeed 🙂 We’re slowly inching toward the coveted 90+ mobile GPSI score!
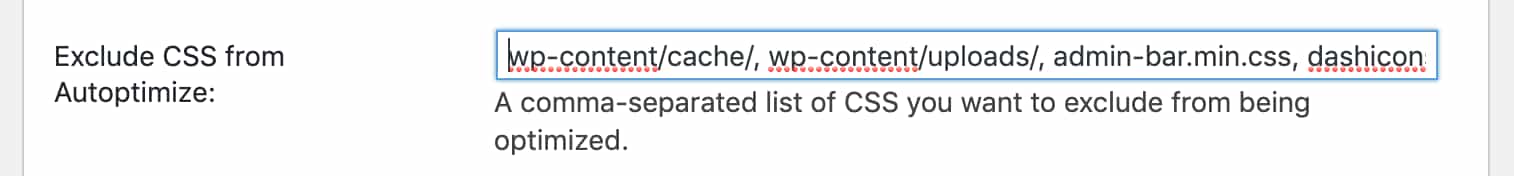
Merge Shoptimizer main.min.css with Autoptimize CSS
Shoptimizer ships with it’s own highly optimized minified main CSS file. This is really useful for ensuring the default theme experience is as fast as possible without going through the kind of deep performance optimization we’re doing in this guide. But now that we’ve seen GPSI likes us to serve as few requests as possible it’s time to merge this css file in with the main Autoptimize CSS file. It’s very straightforward to do this, simply remove main.css and main.min.css from the list of excluded css files in Autoptimize.
Our GPSI Scores with after merging main.min.css :
- Mobile: 86 (+2 points)
- Desktop: 98 (+2 points)
One interesting thing to note is that the AO option to Optimize HTML Code doesn’t seem to have any real impact on either our GPSI scores or our overall load time. If your HTML payload is larger than ours you might see different results so you may want to experiment with that setting. As I’ve seen this setting break some WooCommerce stores from time to time I’m leaning towards leaving that off for now.
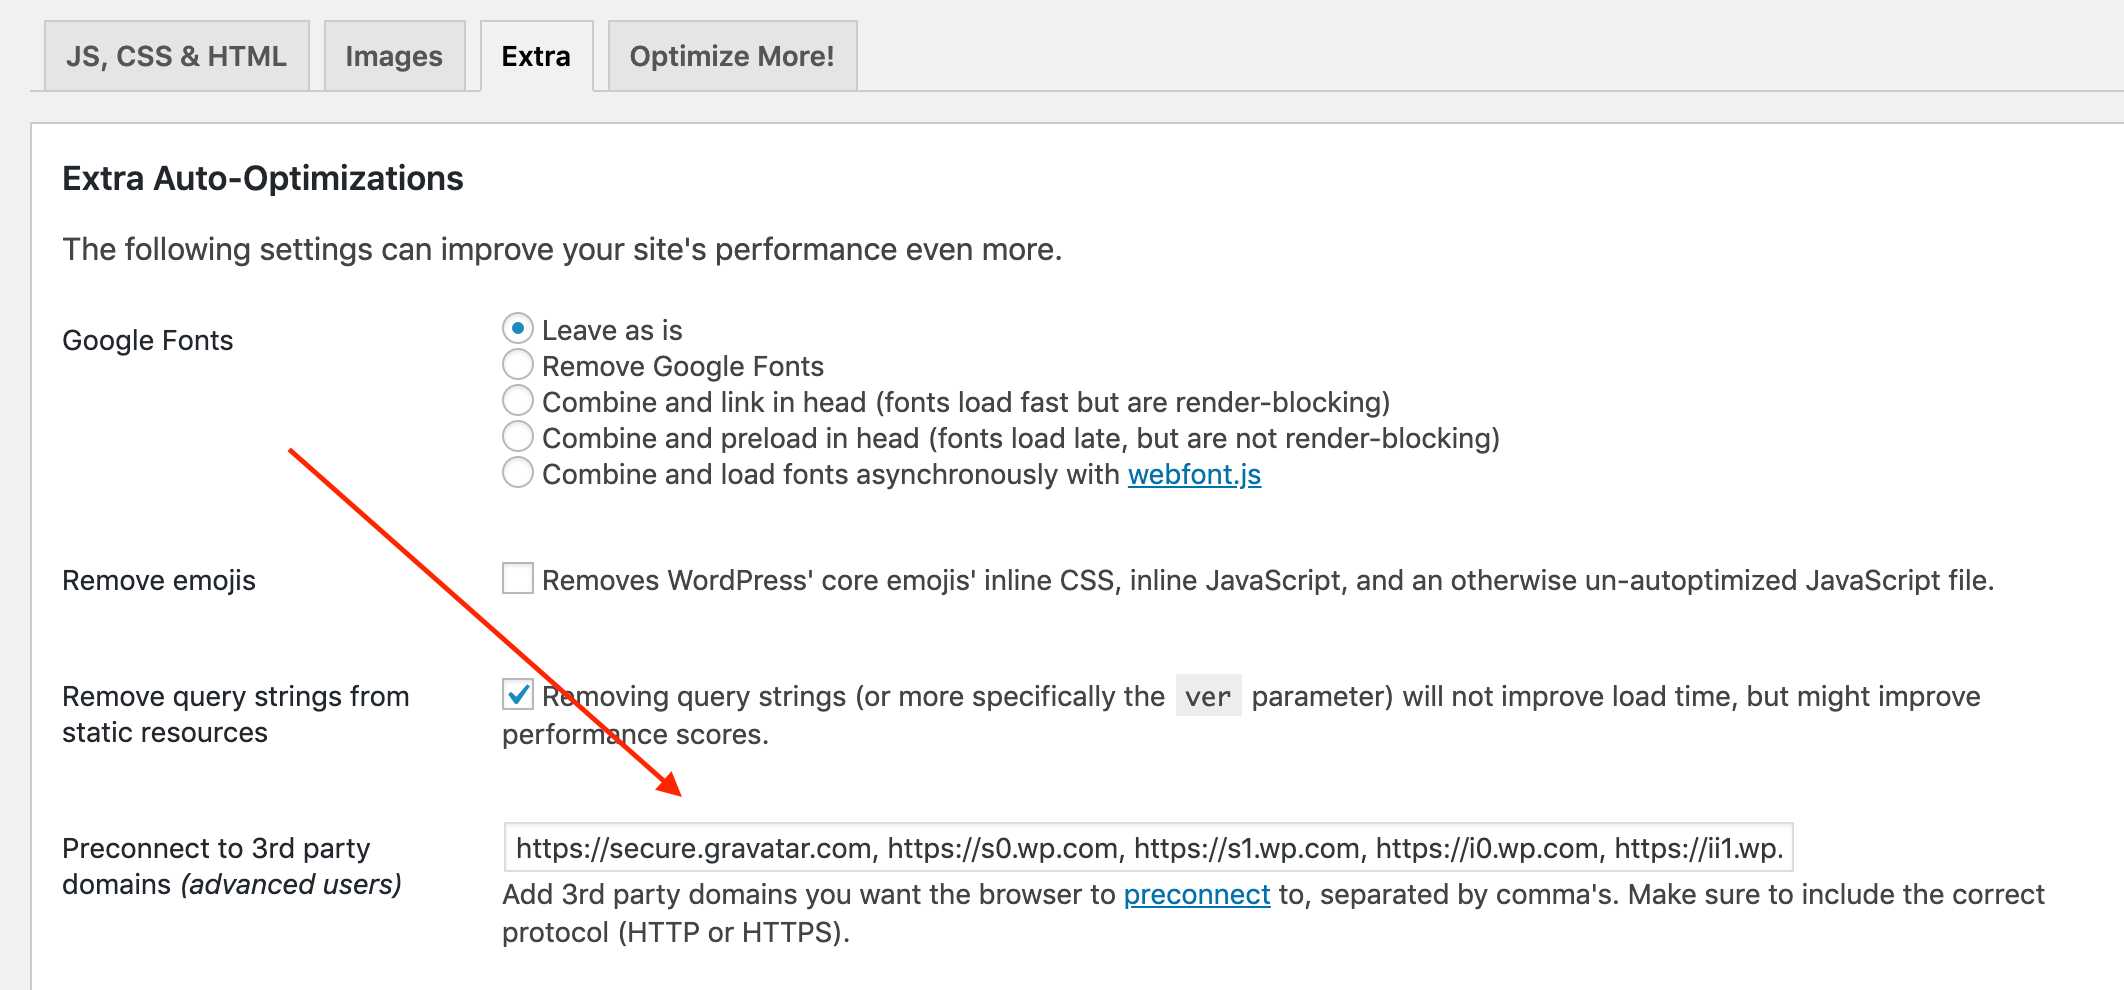
Preconnect external domains
What does Preconnect do?
Preconnect allows your browser to quickly establish connections to external servers early in the Waterfall before they’re actually executed. If you remember our forensic analysis of our HTML documents http request earlier, you’ll remember that we have a few hundred miliseconds dedicated to just figuring out the DNS lookup, the TCP connection and the SSL handshake. If your WooCommerce store connects to 10 different external domains those connection times can quickly become a significant bottleneck of a couple of seconds!
You can easily determine the list of external domains your website relies on via WPT’s Domain breakdown. See an example here. (NOTE: This is an example where we use WPT to go into a bit more detail than GTMX). We then compile this list as follows:
https://secure.gravatar.com, https://s0.wp.com, https://s1.wp.com, https://i0.wp.com, https://ii1.wp.com, https://ii2.wp.com, https://is0.wp.com, https://istats.wp.com, https://ifonts.googleapis.com, https://ipixel.wp.com, https://ifonts.gstatic.com, https://fonts.googleapis.com, https://fonts.gstatic.com, https://www.google-analytics.com/, https://www.googletagmanager.com/Then, head back to your AO settings and add your full domain list to the relevant setting in the Extras tab.
WPT does a better job than GTMX at showing how preconnect helps us out. Note how the DNS lookup, TCP connections and SSL handshakes take place well before the actual http request takes place.
Let’s re-run GTMX and see what impact our preconnect and main.min.css merging have had.

- We’ve shaved another 171ms of our fully loaded time.
- We’ve removed 1 additional http request and shaved a tiny 1.52kb off our total page size.
You can see we’ve definitely picked off all the low hanging fruit at this stage and we’re having to work harder to find much smaller incremental gains. Such is the way with performance optimization!
Our GPSI Scores with after adding Preconnects
- Mobile: 87 (+1 point)
- Desktop: 99 (+1 point)
Let’s keep going and see what else we can do to eek out some further incremental gains.
Performance vs. Features – decide which is more important to you
So our desktop score is nearly at the magical 100/100! Our mobile score of 87 is also pretty damn good at this point. Frankly, you could stop worrying about your GPSI scores at this point and concentrate on something more productive.
We’re pretty much at a point now where we have to make hard decisions about what is more important to us, achieving the best possible load times and GPSI scores – or website features and functionality. This is particularly true for eCommerce websites that tend to have a few more bells and whistles than your average marketing/corporate website.
Things that didn’t help our GPSI or GTMX scores at this point
Before we start making some feature compromises I tried a few other simple things that are all worthwhile doing for performance best practices, but which didn’t really help with GPSI scores.
Remove query strings from static resources
By default WordPress and WooCommerce typically include query string arguments for CSS and JS http requests in the format:
woocommerce/assets/css/blocks/style.css?ver=3.6.2In this example WooCommerce includes the WooCommerce version as a query string which ensures that when WooCommerce is updated the users browser will get the new version of the CSS file as most web servers and browsers won’t cache a http request with a query string and when the new version appears in the query string your browser treats the request as a brand new file.
This shows up as a red flag on most web performance tools – which is fine as technically it is something you want to avoid from a pure web performance perspective. But it’s important to remember that if we remove query strings from static resources it may mean that users end up seeing out of date versions of static files which could break your website. This is especially true now that we’ve set our expires to be 1 year!
This is less of an issue if you’ve been following along with everything we’ve been doing here and you’re using Autoptimize to deliver your CSS and JS as Autoptimize mitigates this issue somewhat by using frequently changing hash values for your concatenated CSS/JS files. So as long as you clear your AO cache after updating your WordPress and WooCommerce plugins you should be fine.
AO itself allows us to quickly set this up in the Extras tab.
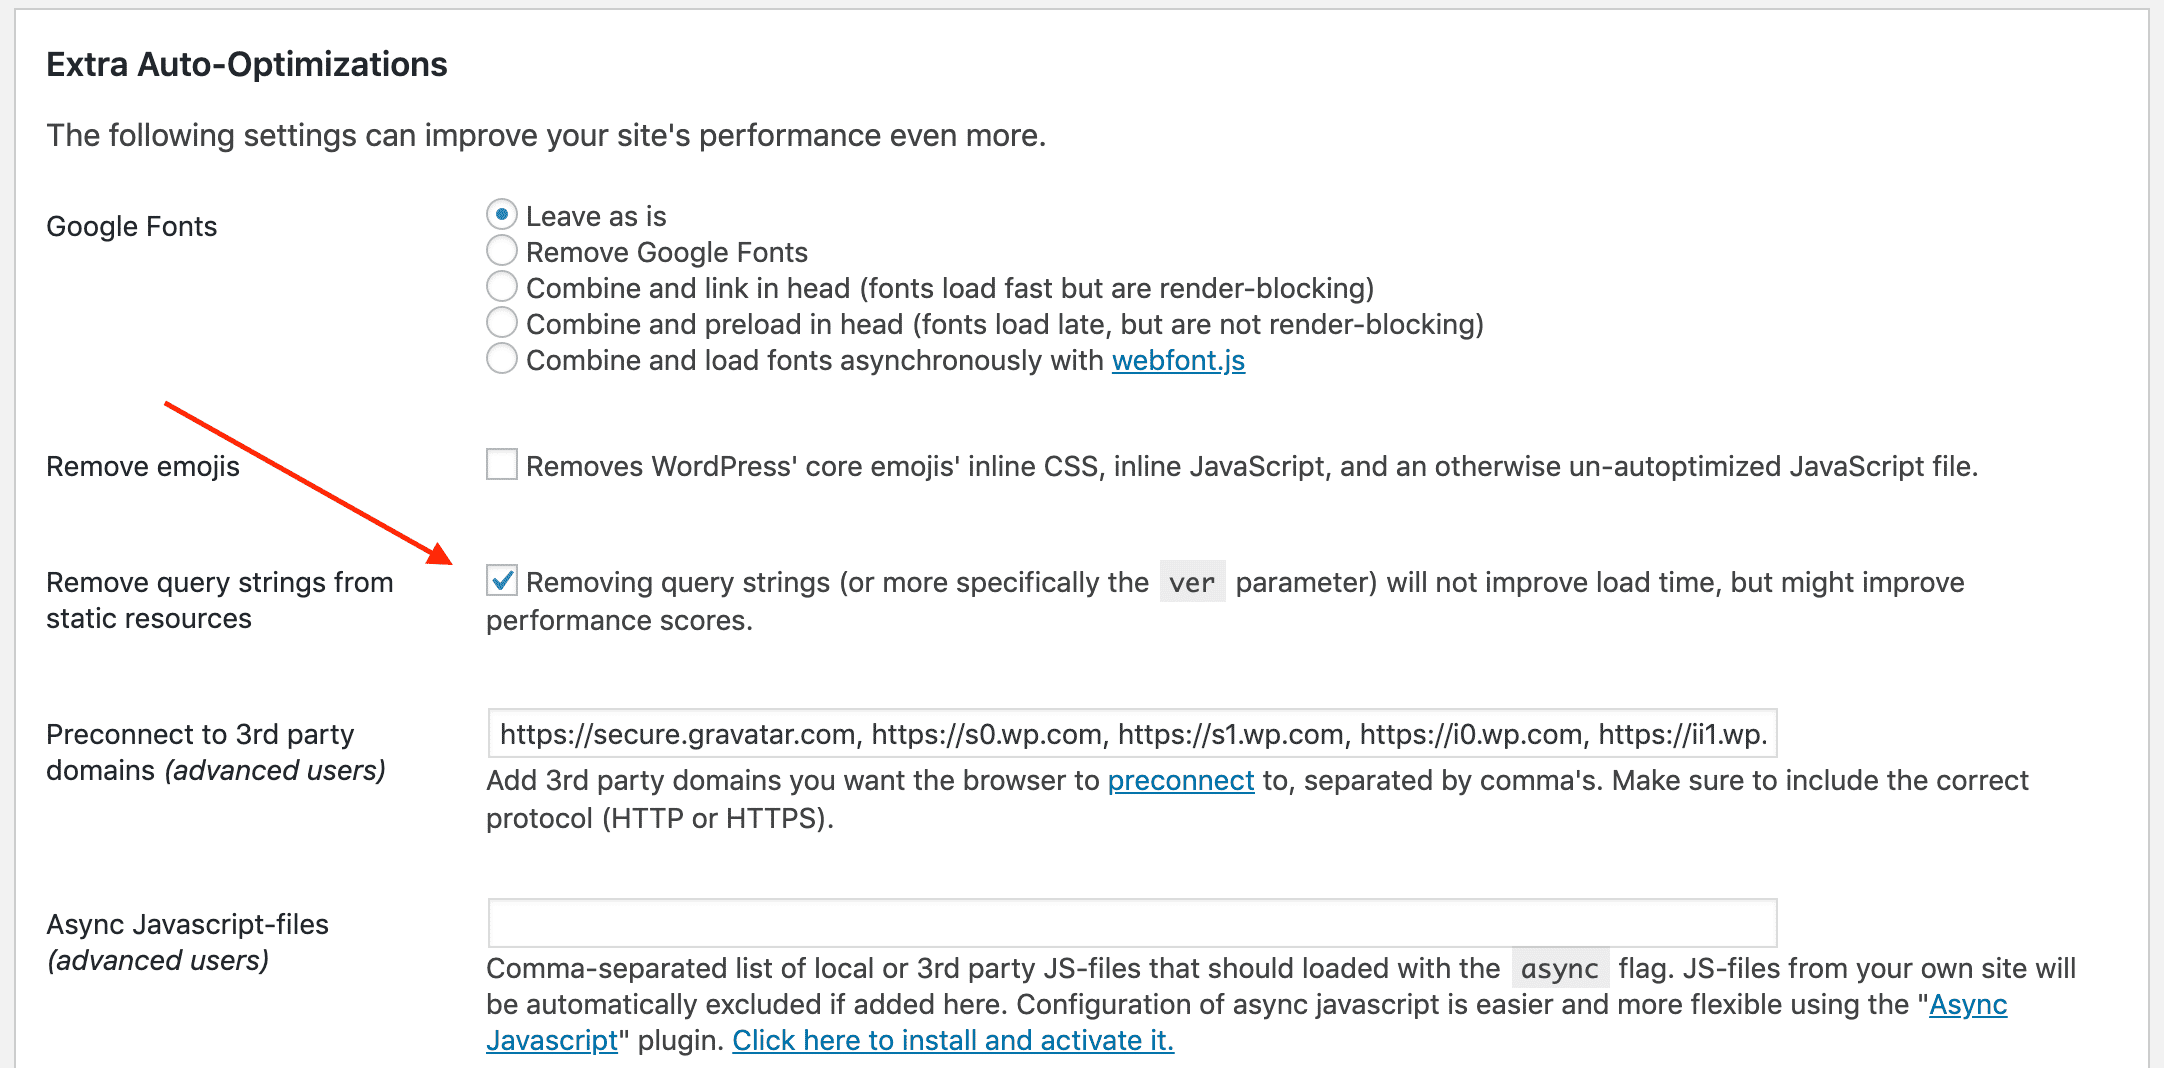
While it helps remove red flags in GTMX it didn’t help our GPSI scores so don’t worry too much about this setting if you’re experiencing issues with old CSS/JS caches appearing on your website.
Inlining ALL our CSS
You used to see this recommendation on a lot of website performance blog posts in the past. It used to be a great way of artificially boosting your GPSI scores, even though it’s inherently a bad idea to deliver ALL your CSS inline. (It’s a bad idea as your browser has to download your CSS from scratch for every page on your site when it’s inline). Thankfully GPSI has figured this out now and doesn’t reward inlining all css anymore.
Our next action is definitely a compromise decision but significantly improves a lot of our web performance metrics.
Remove Google Tag Manager and Google Analytics scripts
HeadSoundsDirect uses Google Tag Manager (GTM) to deliver Google Analytics for WooCommerce. GTM is an awesome tool for managing all the various little tags you inevitably end up needing to deploy on modern eCommerce websites. Right now we’re just using it for Google Analytics which is probably overkill. Here’s the other thing – both Google Tag Manager and Google Analytics can be significant bottlenecks for your website. Let me demonstrate. Once I switch off Google Tag Manager (which also removes our 2 Google Analytics js requests), here’s how GTMX is looking.
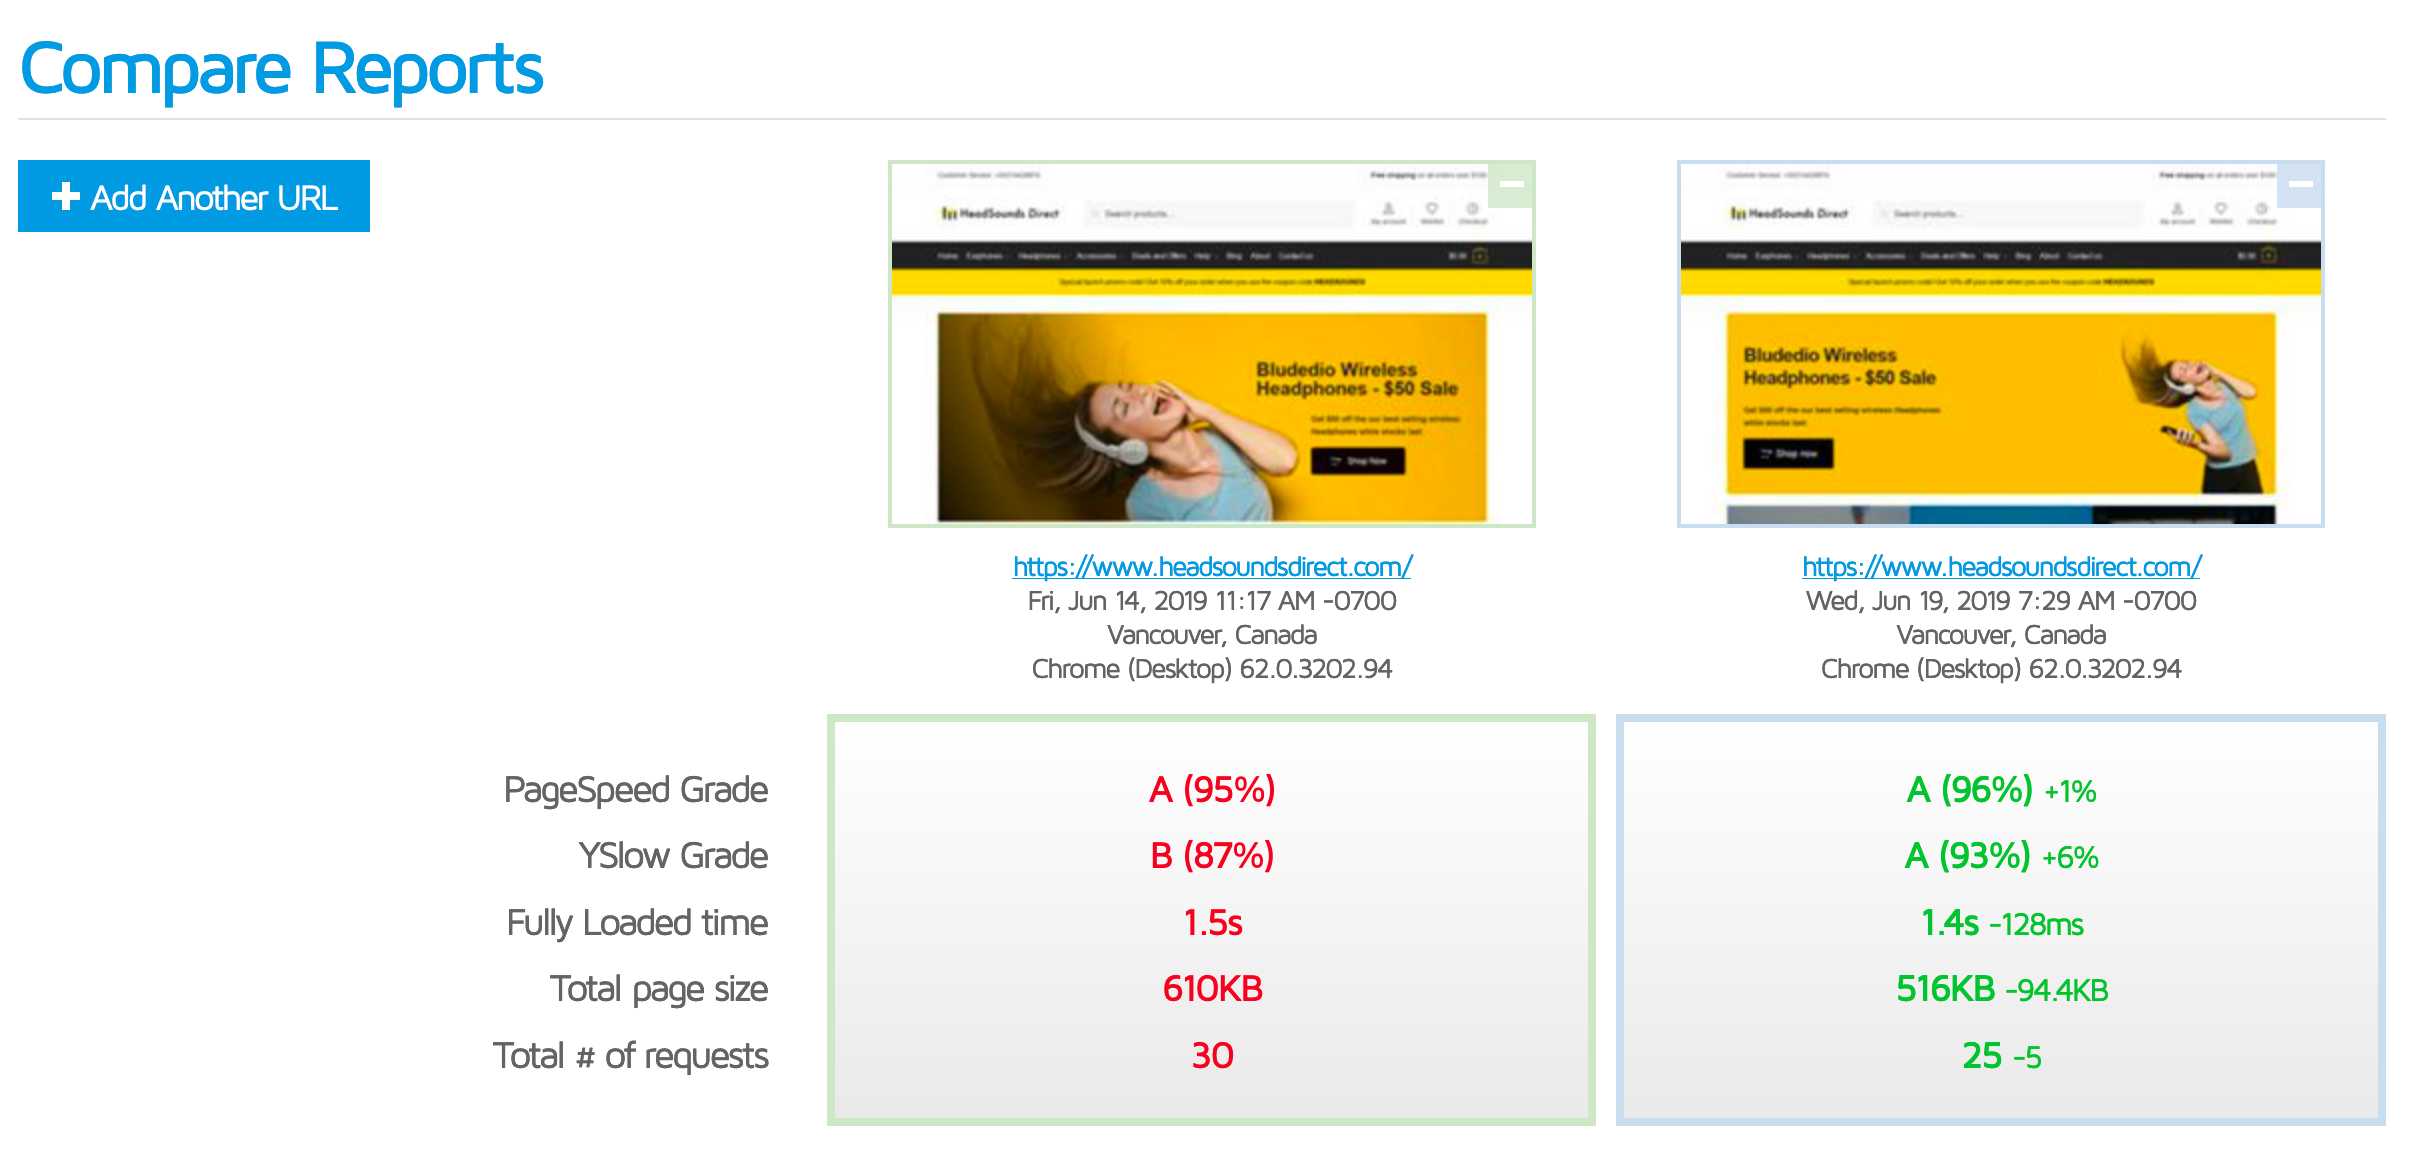
- Fully loaded time is down another 128ms
- Total page size is down 94.4kb
- Total # of requests is down 5
So really solid GTMX improvements!
Our GPSI Scores with after removing our Google scripts:
- Mobile: 92 (+5 points)
- Desktop: 100 (+1 point)
We’ve broken the 90+ Mobile GPSI score and finally hit 100/100 Desktop GPSI Score – yay!
But at what cost? We’ve now lost one of the most important tools that I use to measure the success of our online business! But there are many people who don’t want to use Google Analytics (or who simply can’t for legal reasons) and it’s important to demonstrate that Google itself is one of the things stopping you from improving your GPSI scores.
There are alternative methods to serving your Google Analytics scripts from your local server like COAS which help somewhat to mitigate this bottleneck. But it still limits you as most WordPress and WooCommerce Google Analytics plugins don’t play nice with COAS. (with the exception of the pro version of the Monster Insights GA plugin).
We also made one other small change in this test cycle, we swapped out our homepage hero image with a slightly different, smaller version of the same image.

The old image was was 23kb while the new one is 19kb (so only 4kb smaller) and arguably isn’t as impactful as the original – so why the change? The original was loaded as a background image in Elementor and Jetpack currently can’t lazy load background images from Elementor, so I swapped in an image element in it’s place (which Jetpack does lazy load) so in practice it helps very slightly with our perceived load times (in addition to offloading the image to Jetpacks servers).
I actually did run an isolated GTMX/GPSI test run at the time I did it but forgot to take screenshots (for shame!) and I can tell you it didn’t impact on our GPSI scores – so the 5 point mobile GPSI improvement from removing GTM/GA isn’t in some way related to this change. But it will definitely helps with fully loaded times and our bandwidth costs 🙂
How can we get closer to a 100/100 GPSI score on mobile?
At this point we’re well and truly into feature compromise territory for further GPSI score improvements. But for the hell of it, let’s see how close to a 100/100 GPSI mobile score we can get without totally hobbling our website.
Remove WooCommerce Ajax Cart Fragments
If you’ve been paying attention to your waterfall charts you might have spotted one other large bottleneck that’s looks a bit like this.
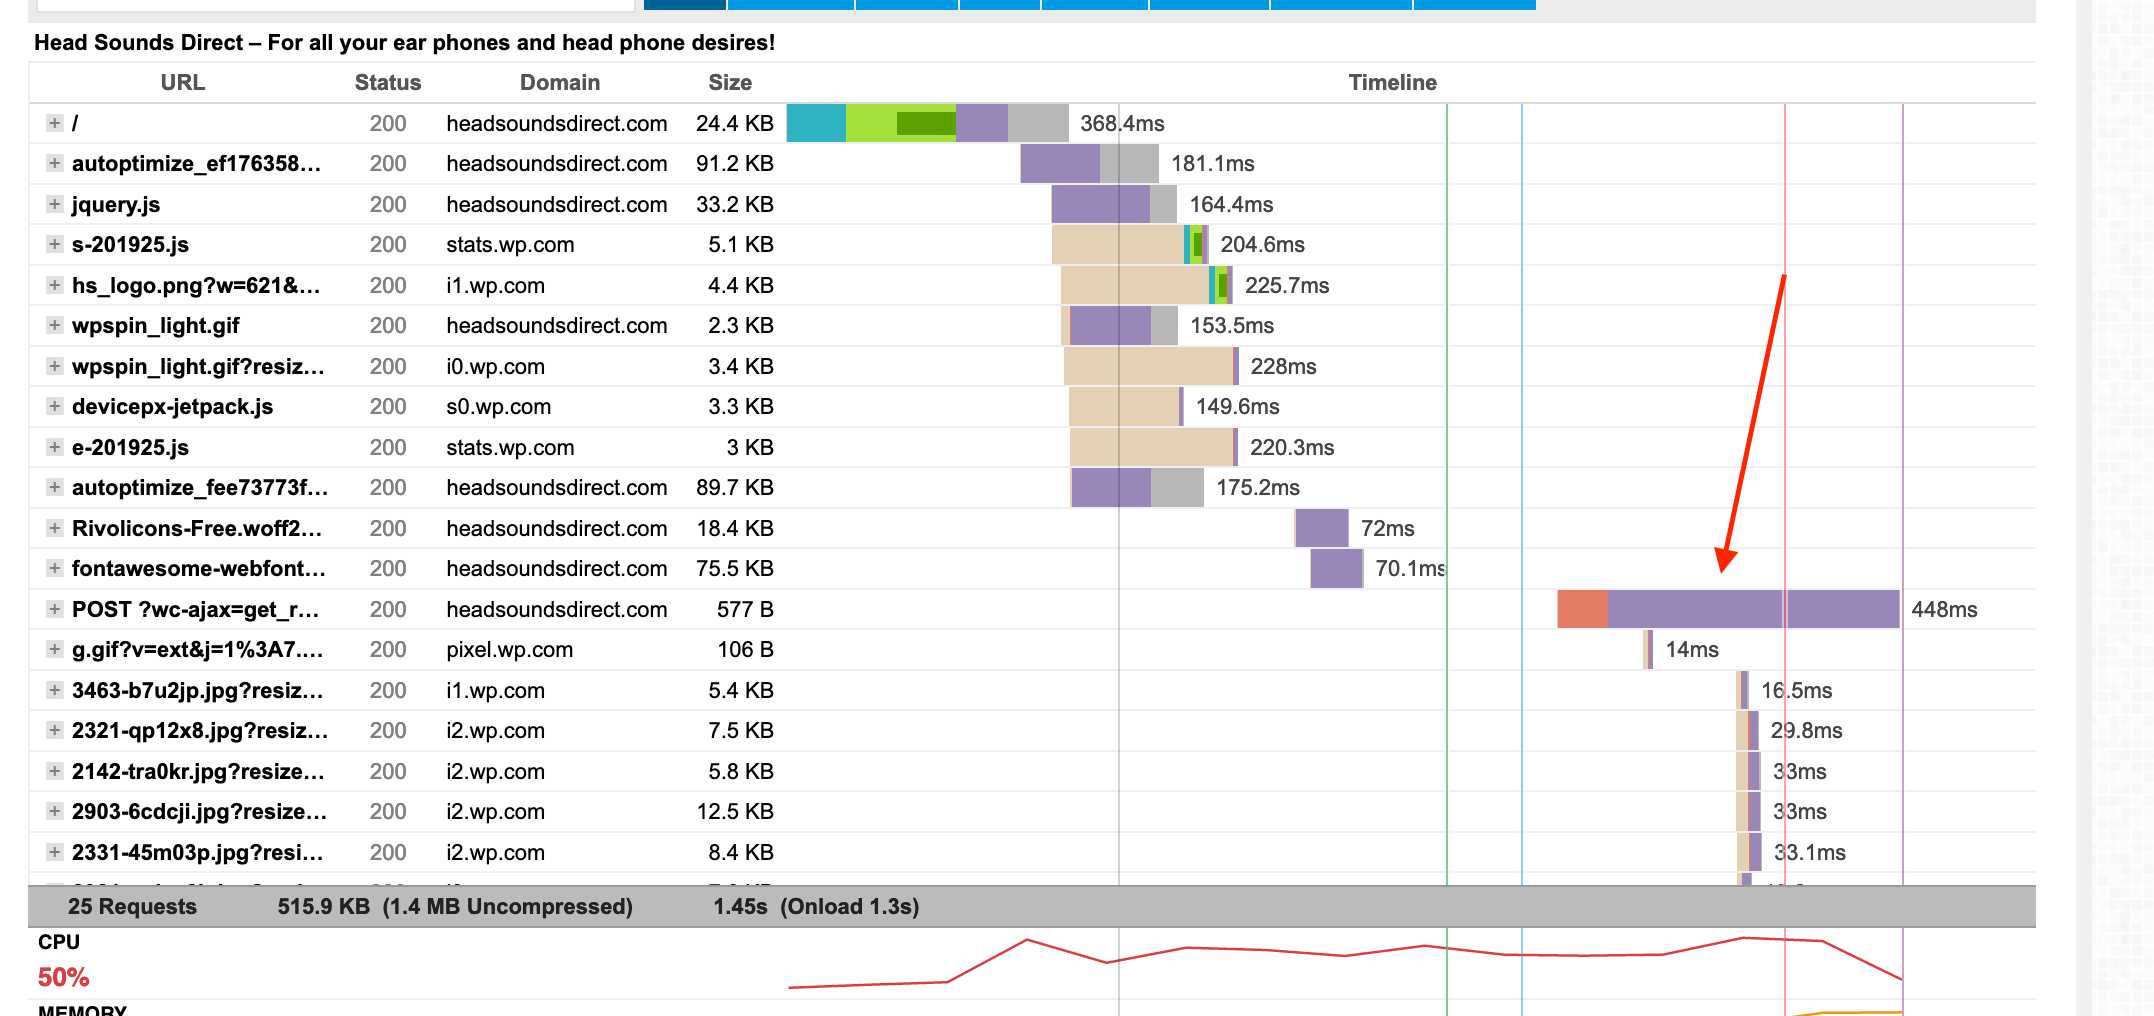
This is an ajax request that WooCommerce triggers to fetch the contents of the users shopping cart called wc-cart-fragments that we covered earlier in our initial Waterfall analysis. You’ll spot it in your waterfall as it’s always a POST request with the url string ?wc-ajax=get_refreshed_fragments.
You can see in our screenshot above that the request time takes 448ms which is by far our slowest http request at this point. On some slower servers with large, poorly optimized databases, this request can often take more than 1-2 seconds to execute. The good news is that this request is non-blocking and executes well after the DOM is loaded so in general it doesn’t hurt our perceived load times (but definitely hurts our fully loaded times and can hurt some things that GPSI worries about like Time to Interactive and First CPU idle).
In general I don’t recommend removing or caching this unless it’s a major bottleneck for you as it can definitely cause issues with your WooCommerce store (like users seeing cached/inaccurate/empty carts). But if you remove your dynamic cart display (which in of itself is a good performance trick for high volume WooCommerce stores) then you can safely remove this request. To do so, you’ll need this small PHP code snippet. Use the wonderful Code Snippets plugin to add this your website frontend only.
 /**
  * Get rid of cart fragments on our homepage.
  */
 add_action( 'wp_enqueue_scripts', 'ccfw_dequeue_woocommerce_cart_fragments', 11 );

 /**
  * Get rid of cart fragments on our homepage.
  */
 function ccfw_dequeue_woocommerce_cart_fragments() {
	if ( is_front_page() ) {
	if ( is_front_page() || ( is_page_template( 'template-fullwidth-no-heading.php' ) ) ) {
 		wp_dequeue_script( 'wc-cart-fragments' );
 	} }
 }
This snippet will remove the wc-cart-fragments http request from your WooCommerce store homepage (and includes a specific condition if you’re using Shoptimizer).
Let’s see what this does.
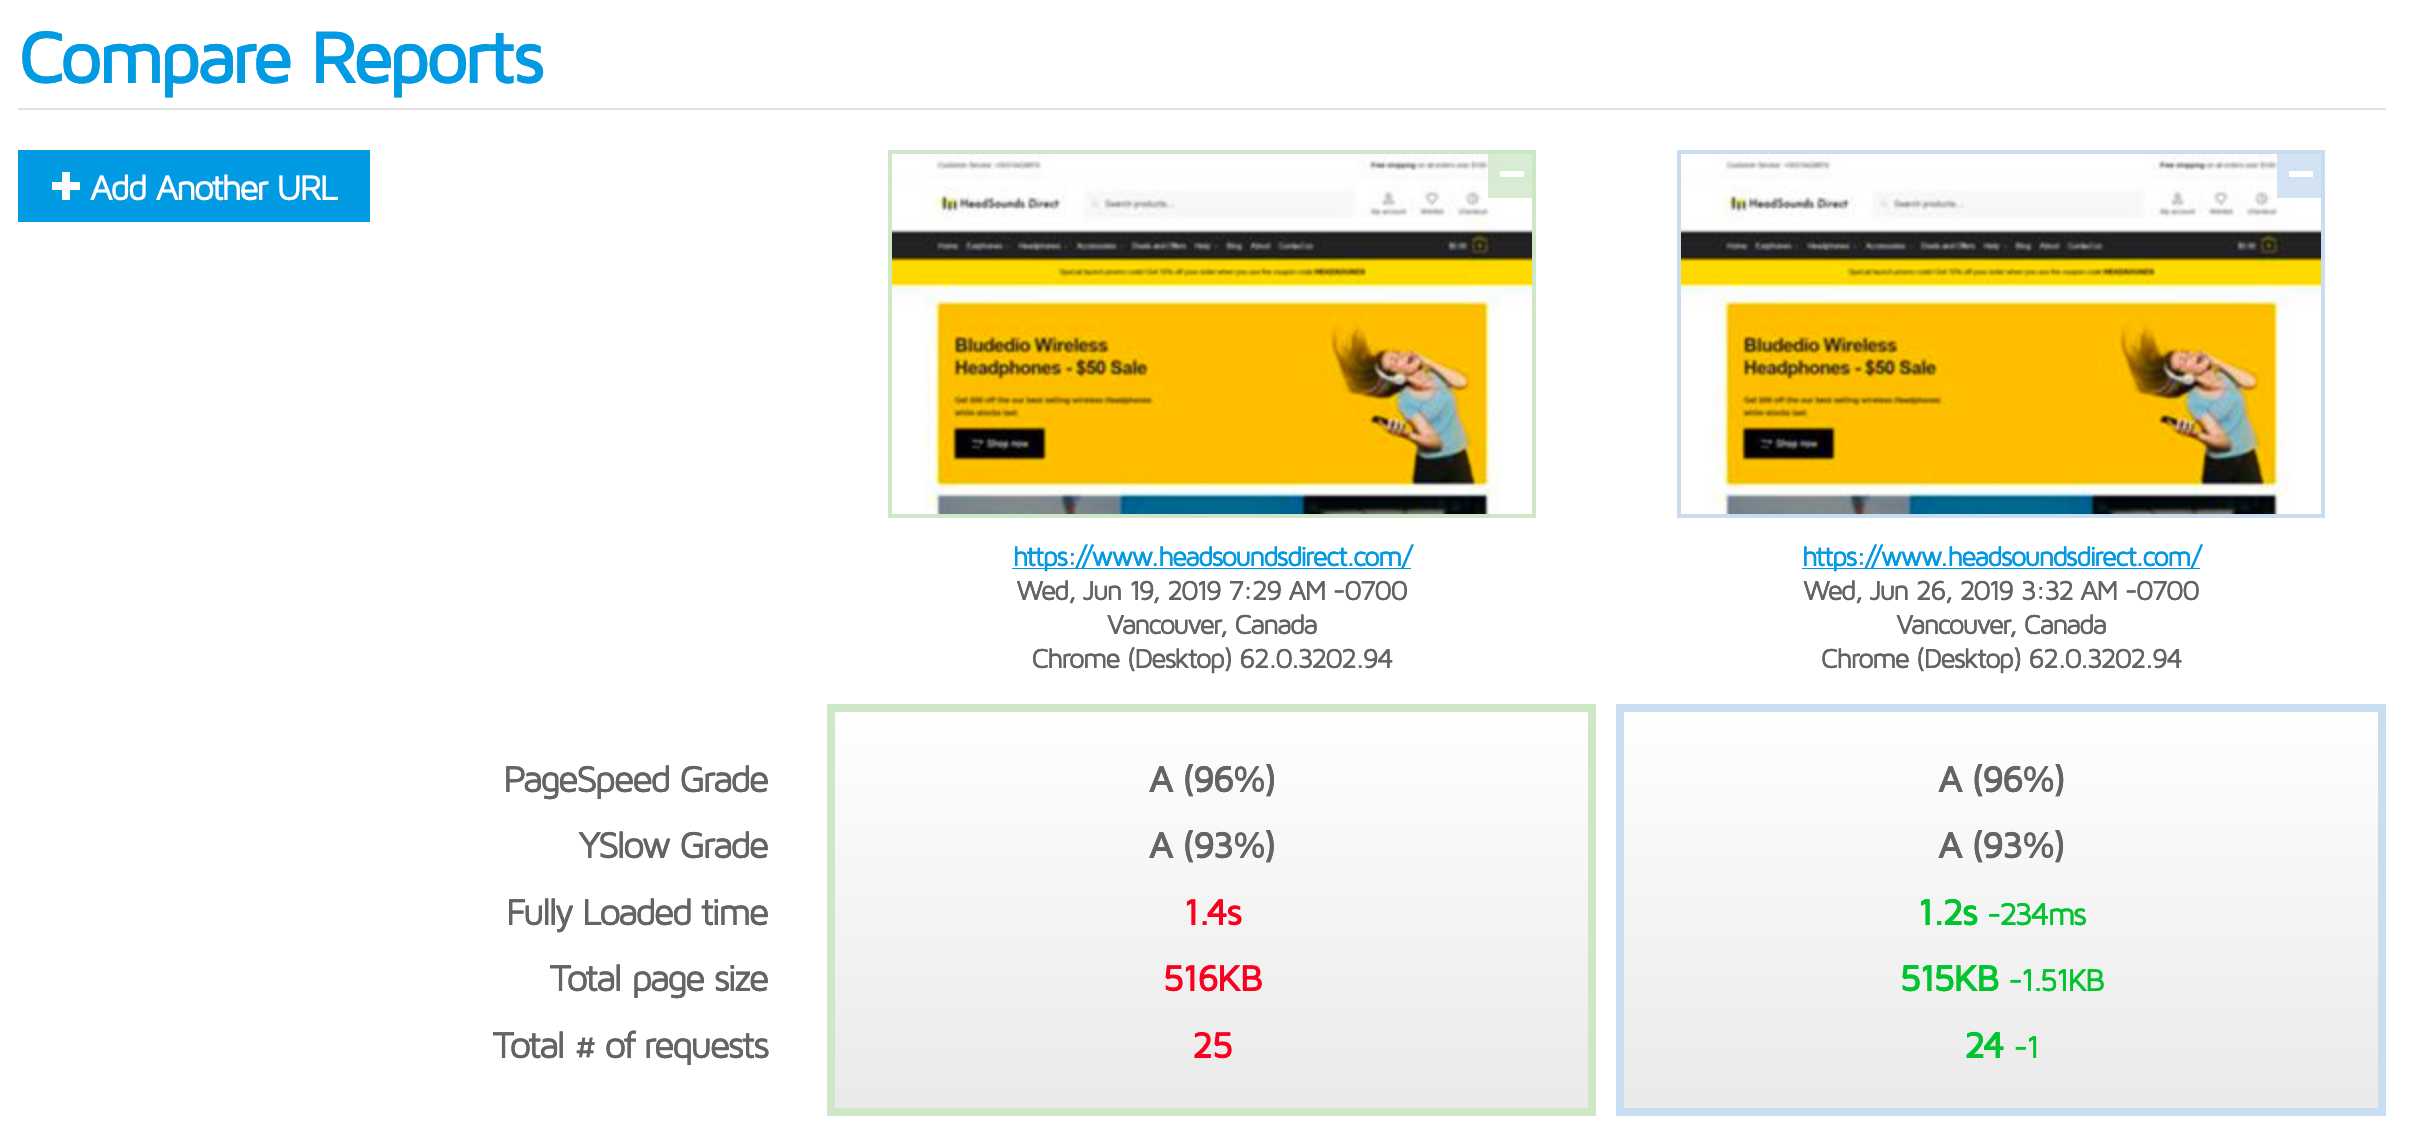
- Fully loaded time is down another precious 234ms
- Total page size is down marginally by 1.51kb
- Total # of requests is down 1 as expected
Our GPSI Scores with after removing our Google scripts:
- Mobile: 92 (unchanged)
- Desktop: 100 (unchanged)
Perhaps more importantly, removing wc-cart-fragments made no real impact to our Time to Interactive or First CPU idle times which is interesting.
Based on the above results I don’t recommend removing fragments as my gains were very minimal versus the cost of said gains.
Eliminate render-blocking resources – make jQuery non-blocking
If you’re like me you’ll have noticed when running your GPSI tests this whole time that this pesky ‘opportunity’ has been hanging around like a bad smell since the beginning.
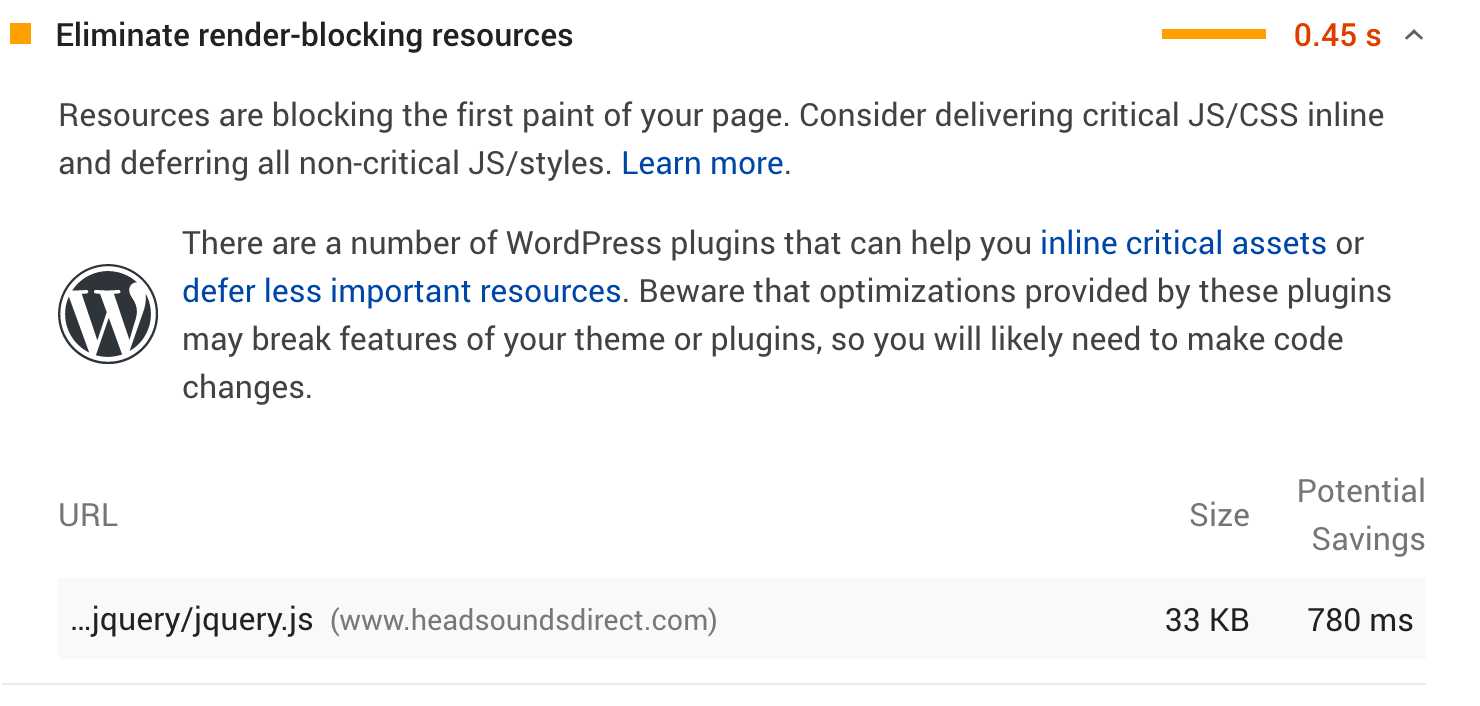
Ah good ‘ol jQuery. You might be wondering why AO simply doesn’t bundle this up with all the other js we load on our website – and why is it loaded in a blocking manner by default? There’s a very good reason for that. jQuery is enqueued by WordPress itself and is used quite a bit by popular WordPress plugins – not least the one we use the most – WooCommerce. Because of this, many many WordPress and WooCommerce plugins assume that jQuery is always present and loaded early in the rendering of your webpages.
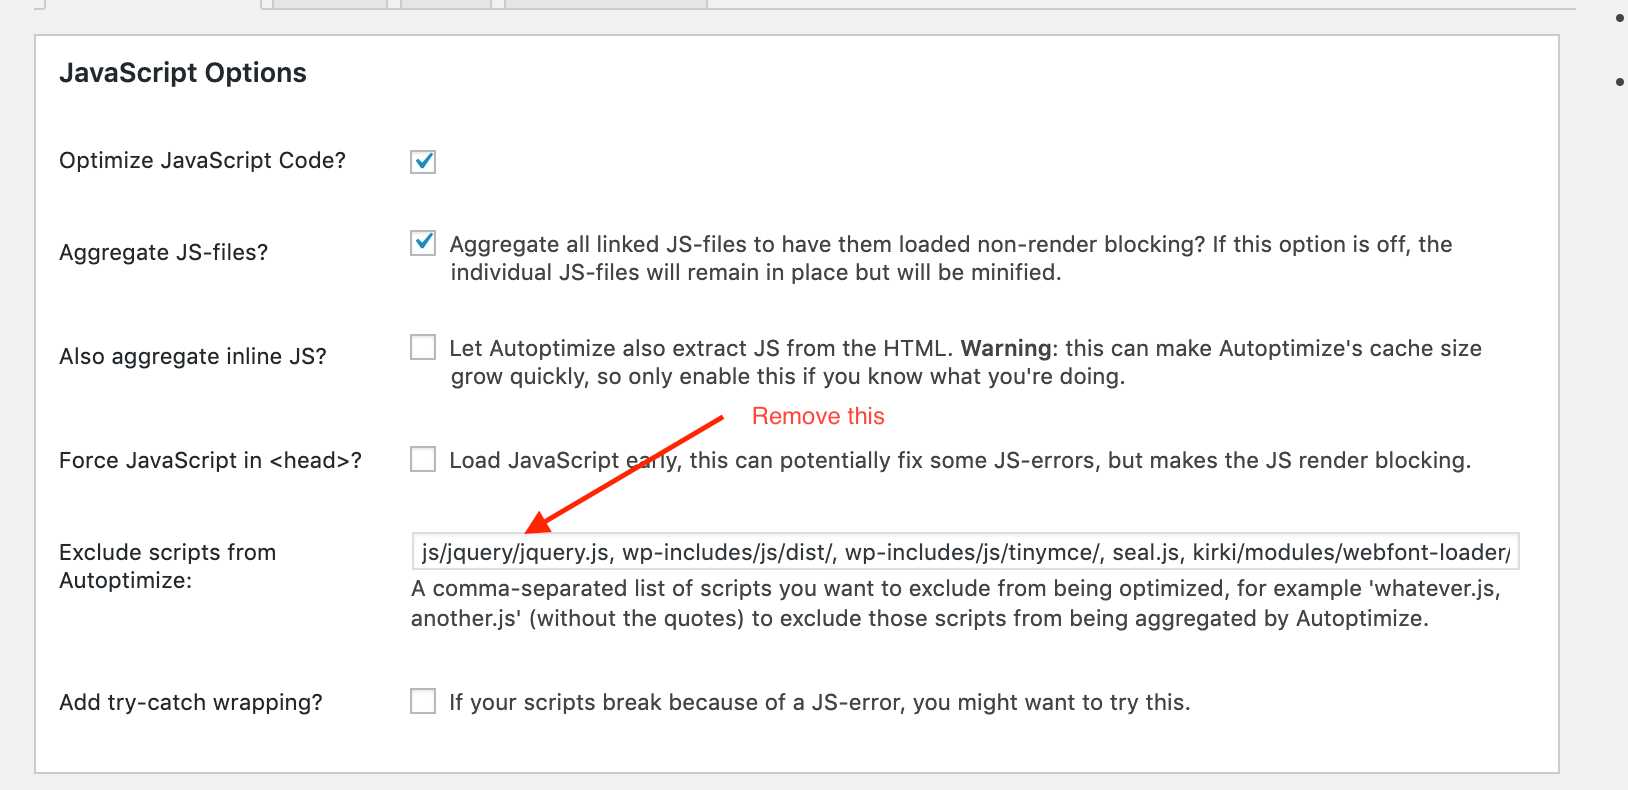
Therefore, AO makes the sensible decision to exclude jQuery from Autoptimize completely by default. If jQuery was aggregated and deferred with all our other js assets it’s almost certain that key features on your WooCommerce website would stop working. Over time this will become less of a concern as WordPress and WooCommerce slowly reduce their reliance on jQuery – but for now I would tread very carefully with making jQuery load in a non-blocking manner. If you want to experiment with it I would recommend only doing it on your staging instance and testing the crap out of it first. To make jQuery non-blocking is trivial with AO – simply remove it from the exceptions list.
Let’s fire up GTMX.
- Fully loaded time is down another 44ms
- Total page size is down by 98kb
- Total # of requests is down 1 as expected
So not massive savings there. But what about GPSI?
Our GPSI Scores with after making jQuery non blocking:
- Mobile: 95 (+3 points)
- Desktop: 100 (unchanged)
Woah that’s a big jump to the GPSI mobile score at this late stage of the game!
But again at what cost has this come at?
You might think at first glance that your website looks fine – and you’d might be right – it probably does indeed look fine. But it’s almost certainly not fine. Fire up the Google console in Chrome and take a look for errors. You’ll see we’ve got one straight away on our homepage.
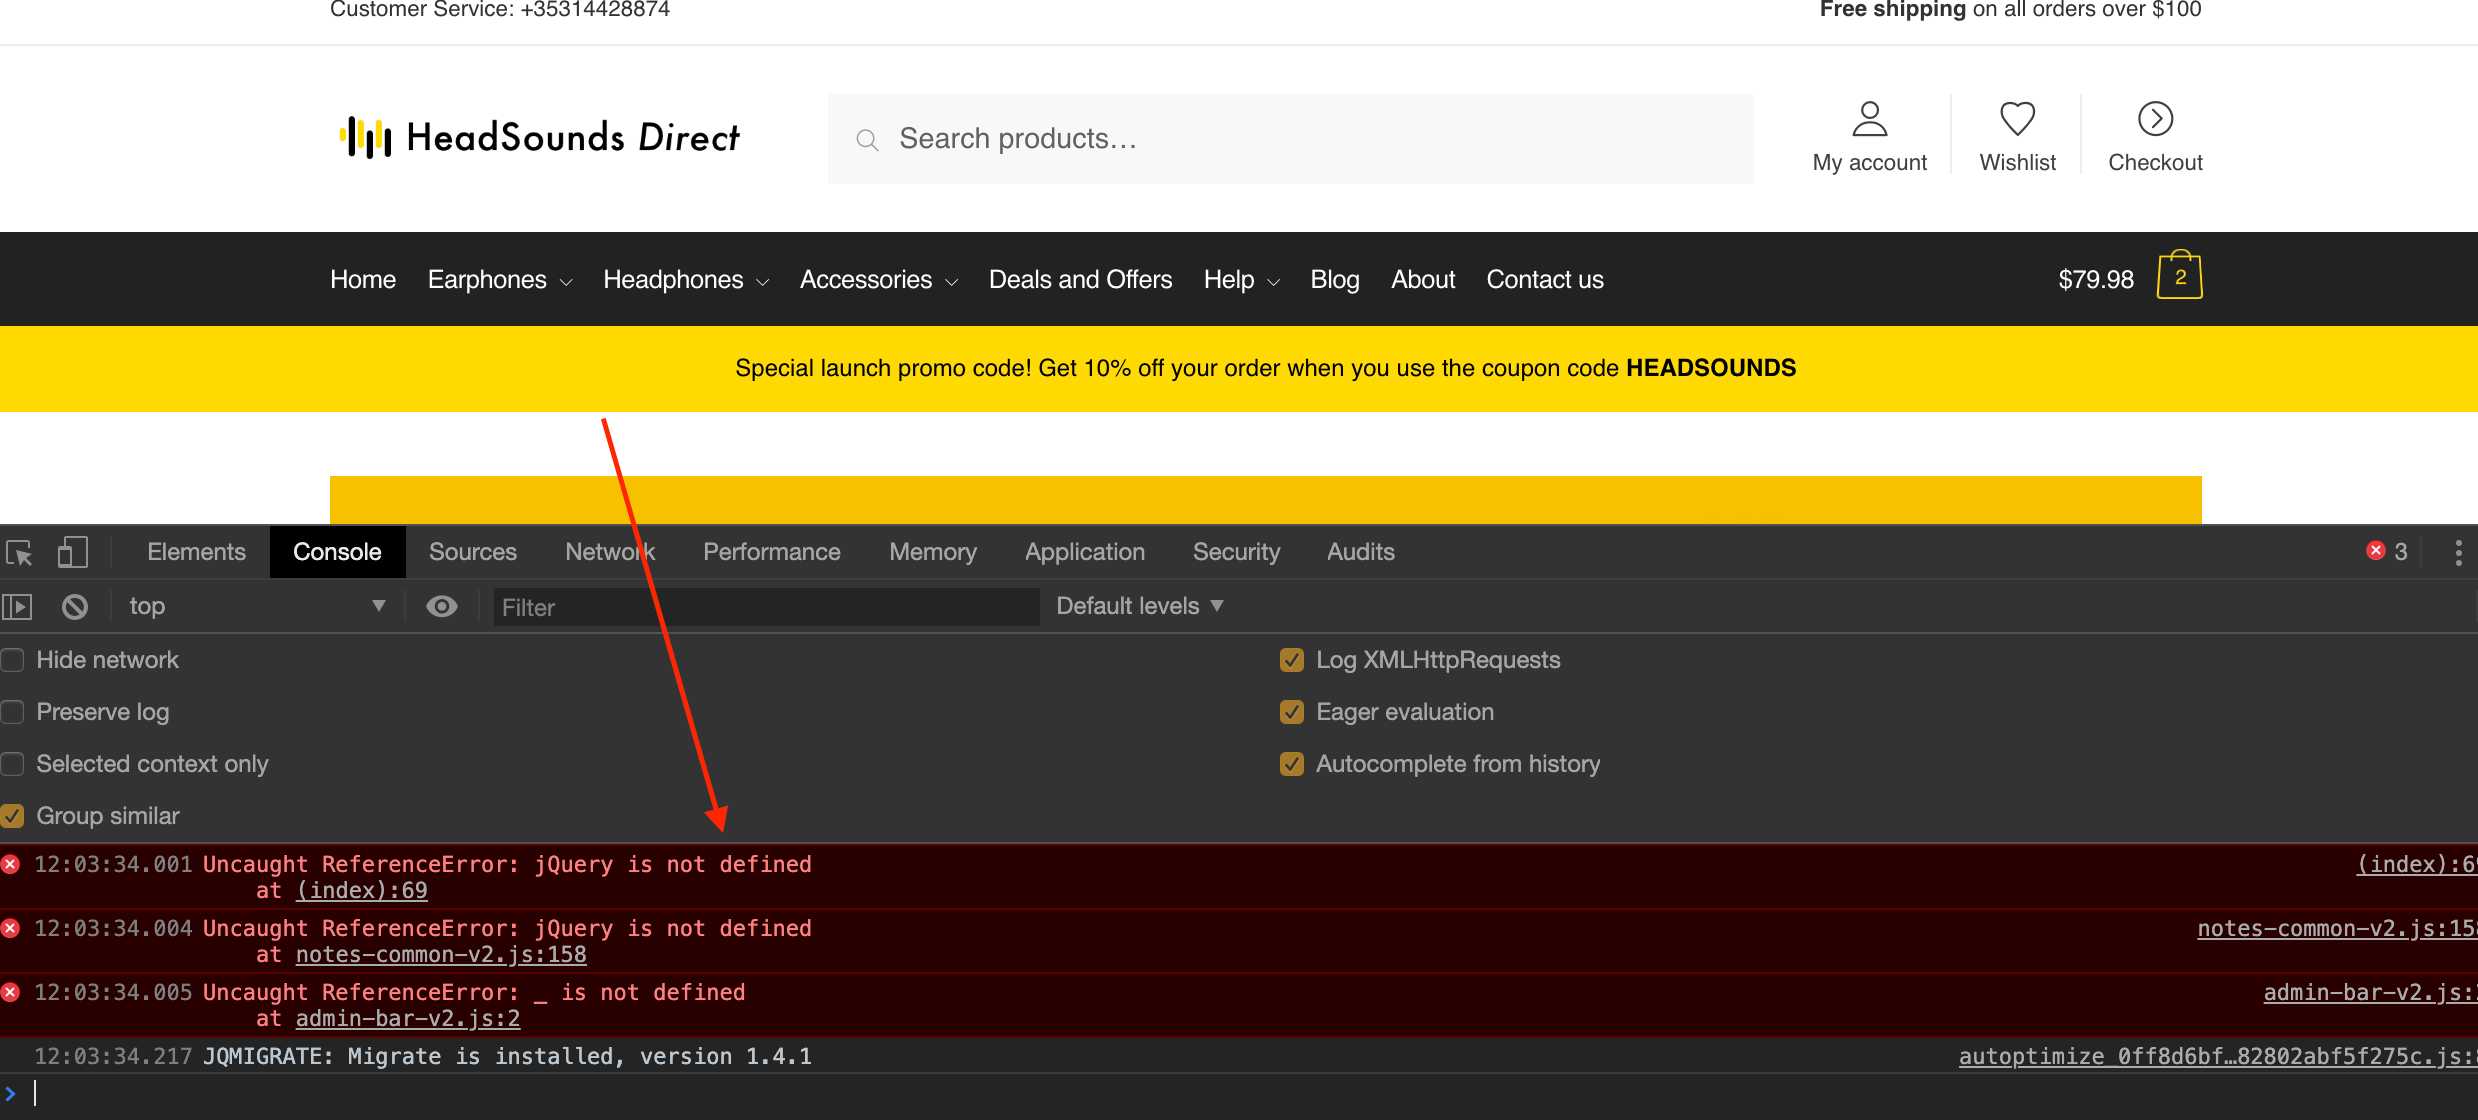
The jQuery is not defined console error is happening because we have some inline js in our HTML that assumes jQuery is loaded in a blocking manner in the head of the markup. Now that our js is deferred, jQuery is not loaded when this js is executed and hence the browser reports that jQuery is not defined (as it is indeed not defined at that point in time). Browsing through HeadSoundsDirect with jQuery in non-blocking mode reveals several other jQuery is not defined errors on our product pages. So for now, we can’t rely on this perf tweak unfortunately.
Wrapping up
So let’s take a look at the full impact to all our performance tweaks from our initial GTMX test run to now.

- Fully loaded time reduced from 2.5 seconds to 1.1 seconds.
- Total page size is down from 6.08MB to 514KB.
- Total # of requests is down from 89 requests to a total of 23 requests.
Our GPSI Scores
- Mobile: Before: 30. After: 94 (+64 points)
- Desktop: Before: 51. After: 100 (+49 points)
What else can we do to speed up WooCommerce?
Overall I’m very happy with where we’ve gotten to in this guide. But – believe it or not – even after nearly 12,000 words (!) there is still ample opportunity to make further performance improvements to HeadSoundsDirect. The challenges we face going forward will require a lot more effort for only marginal gains in things like GPSI scores. But remember while we were actively chasing GPSI scores in parts of this guide, they’re not the be all and end all of website speed and performance.
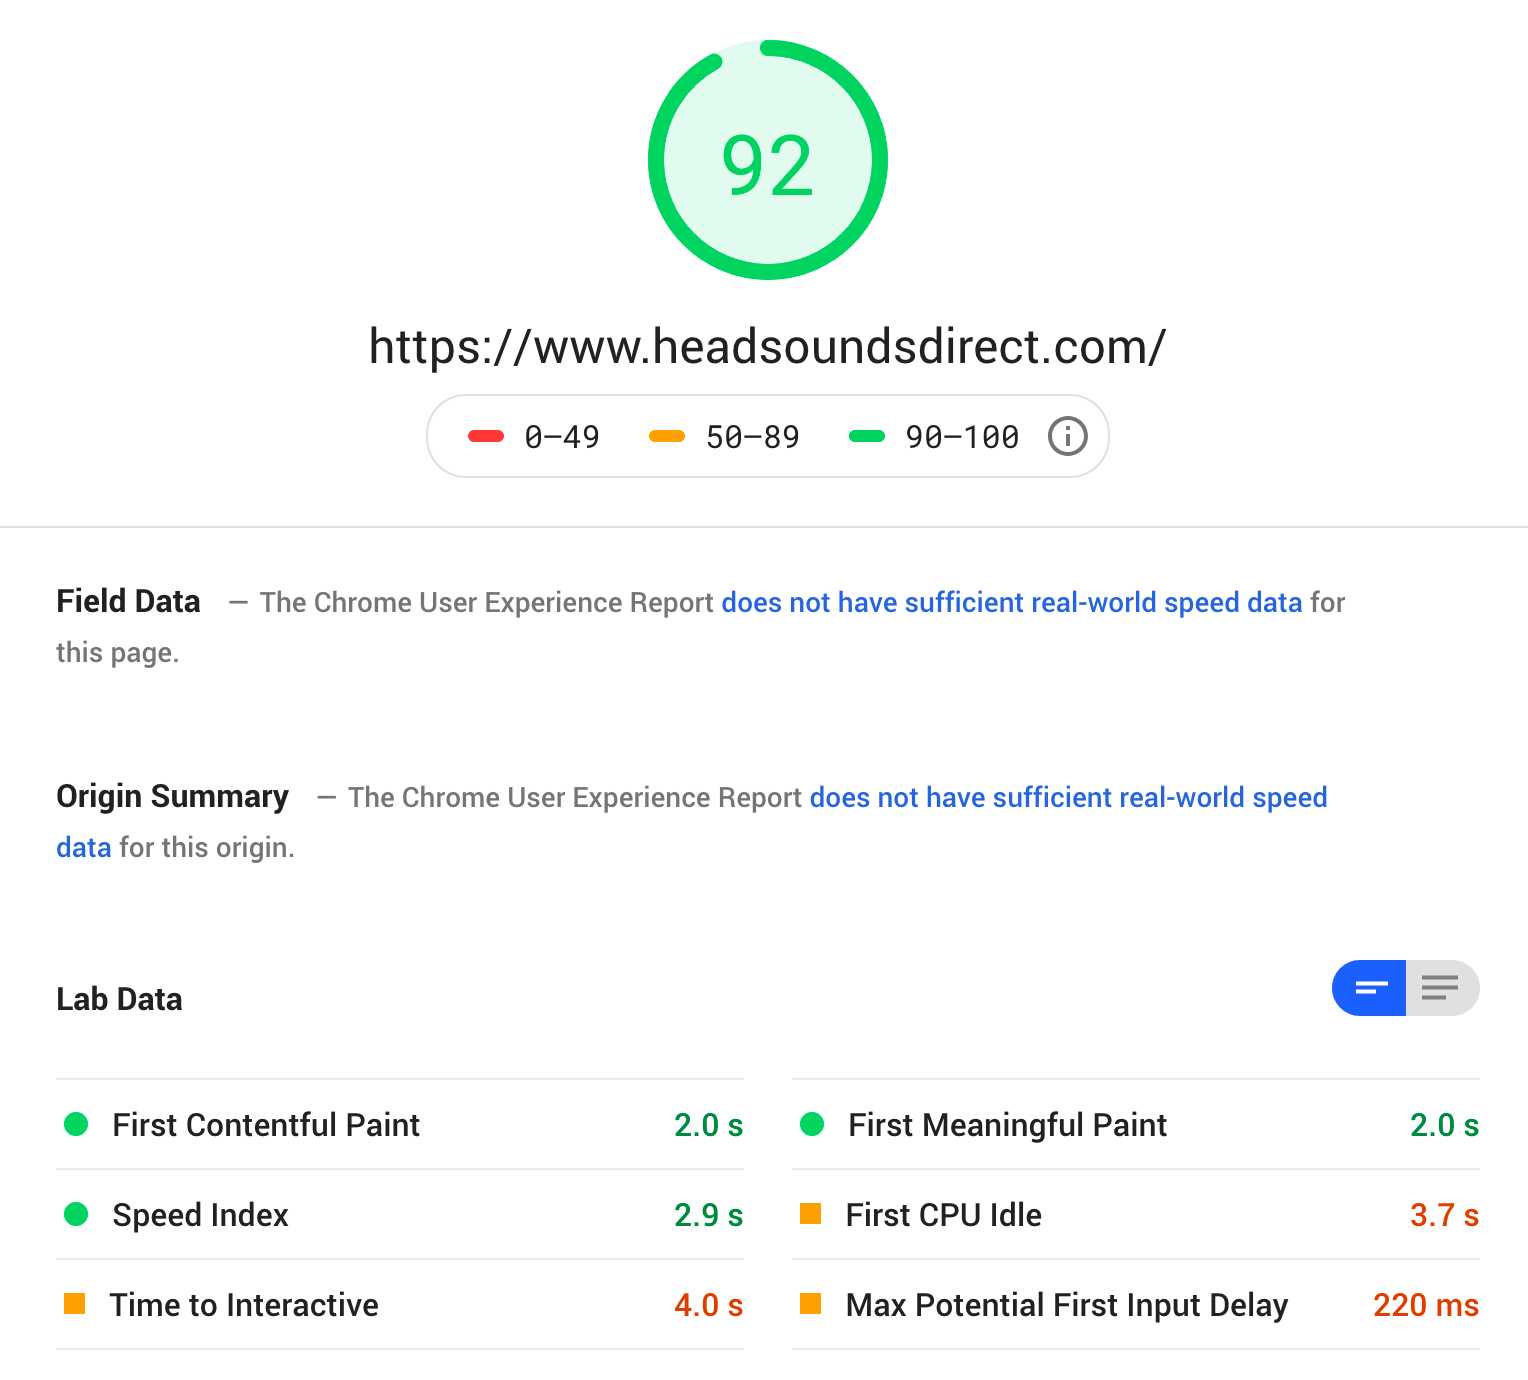
We’ve not really spoken too much here about advanced webperf metrics like First Contentful Paint (FCP), First Meaningful Paint (FMP), Speed Index and Time to Interactive which are becoming the defacto standards for modern eCommerce website performance measurement. We’ll be coming back in a future guide to exploring these in more detail. As for where the opportunities lie for further performance improvements, we certainly have some work to do to remove some unused CSS from our non-render blocking CSS files. We’ll be using a combination of theme enhancements and conditional loading of non-essential plugin assets to see what speed improvements we can eke out there.
My ultimate objective is to get the mobile FCP (as measured by GPSI) under 1.5 seconds which would make a significant impact to the overall perceived speed of the website. Right now with jQuery in render blocking mode we’re at about 2 seconds for mobile FCP – which is still really good – but I would consider under 1.5 seconds to be awesome.
And if you’d rather not do it manually, this is precisely the gap we built our WooCommerce speed plugin to close – CommerceGurus Turbo applies the caching, image optimization, and asset optimization covered in this guide automatically, with defaults that are safe for cart and checkout.
So that’s it for now. If you’ve any questions on anything I’ve covered in this guide I’d love to hear from you! Feel free to get in touch.


Im probably in a minority that would maintain the enthusiasm to read through 12,000+ words on a subject so far from most people’s hearts even if they desire the end result.
A few areas were demystified, snippets of knowledge accrued and at a pace i could relate to having just done exactly the same process myself over the last 2 days.
Bookmarked to keep the knowledge accessible and easy to share with friends!
Many thanks Colm
Excellent detailed discussion of the optimization process for Woocommerce and WordPress in general. Thanks for taking the time to develop this; definitely bookmarking.
We just did the same and got an amazing response. Our score reached 65 to 95 in PSI.
Few suggestions for who wants to follow the above instructions:
1- we got a server cache issue due to which home page was not opening well. (then server cache was been removed by hosting provider and our website was landing accurately)
2- Cart page was not behaving properly while scrolling. then we just unchecked Autoptimize last option (Autoptimize is also active on your shop’s cart/ checkout, uncheck not to optimize those.)
3- Flash of unstyled content (before loading pages some black codes were showing)- the we unchecked CSS option in Autoptimize (- Inline “above the fold CSS” while loading the main autoptimized CSS only after page load)
We are using shoptimize and it’s team helped me to figure out these issues. Now our website (www.woodino.com) is loading and running smoothly.
Thanks Shoptimizer Team
Great speed score!
Hello!
Congratulations on the great post, I have already added it to my favorites, it was the first one I read in such detail regarding the performance of the WC.
I have a question, I’m currently testing on a DigitalOcean VPS with LiteSpeed Web Server plus the LiteSpeed Cache plugin, do you think it’s a good setup to start an e-commerce or can Cloudways be better?
I was testing Cloudways during the testing period and saw that its configuration plus the Breeze plugin are great!
Hello,
I’m very curious how to preload the logo image, I saw that the demo site’s logo is loaded from a third-party site https://i2.wp.com/shoptimizerdemo.commercegurus.com/wp-content/uploads/2018/05/logo_reduced.png?w=500&ssl=1. Which is the 4th request.
But by default, the WordPress logo image is loaded at the last request.
I recently purchased Shoptimizer and am in the beginning of redesign and reconfiguring my website so a lot of work ahead of me. I always felt Woocommerce could be sped up but just didn’t know where to start looking. I’m very impressed with this article, despite being a novice, (but have been around wordpress a long time) and look forward to setting up my old/new website better from the start.
Thank you for an amazing, comprehensive article … just curious … given it was written quite a few years ago, any updates on any of the recommendations?
Cheers,
Dori
Hi Dori, we’ll shortly release a solution which will make WooCommerce performance optimization as simple as a couple of clicks. We’re currently running it on the main Shoptimizer demo so you can check that for PageSpeed and see just how fast it is. For updates on this I recommend subscribing to our weekly newsletter!